Bitcoin (BTC) and the U.S. equity markets are facing selling on Feb. 16 as traders seem to be trimming positions in assets perceived to be risky on the accusation by NATO that Russia continues to build troops near the Ukrainian border.
This is contrary to claims by Moscow that Russian troops are returning to their permanent deployments after completion of the exercise. This geopolitical uncertainty could result in increased volatility in the near term.
However, the longer-term fundamentals continue to strengthen. PwC Luxembourg, in a recent report, said that 61% of 123 Luxembourg-based financial players have either started or plan to start their “crypto journey” soon.
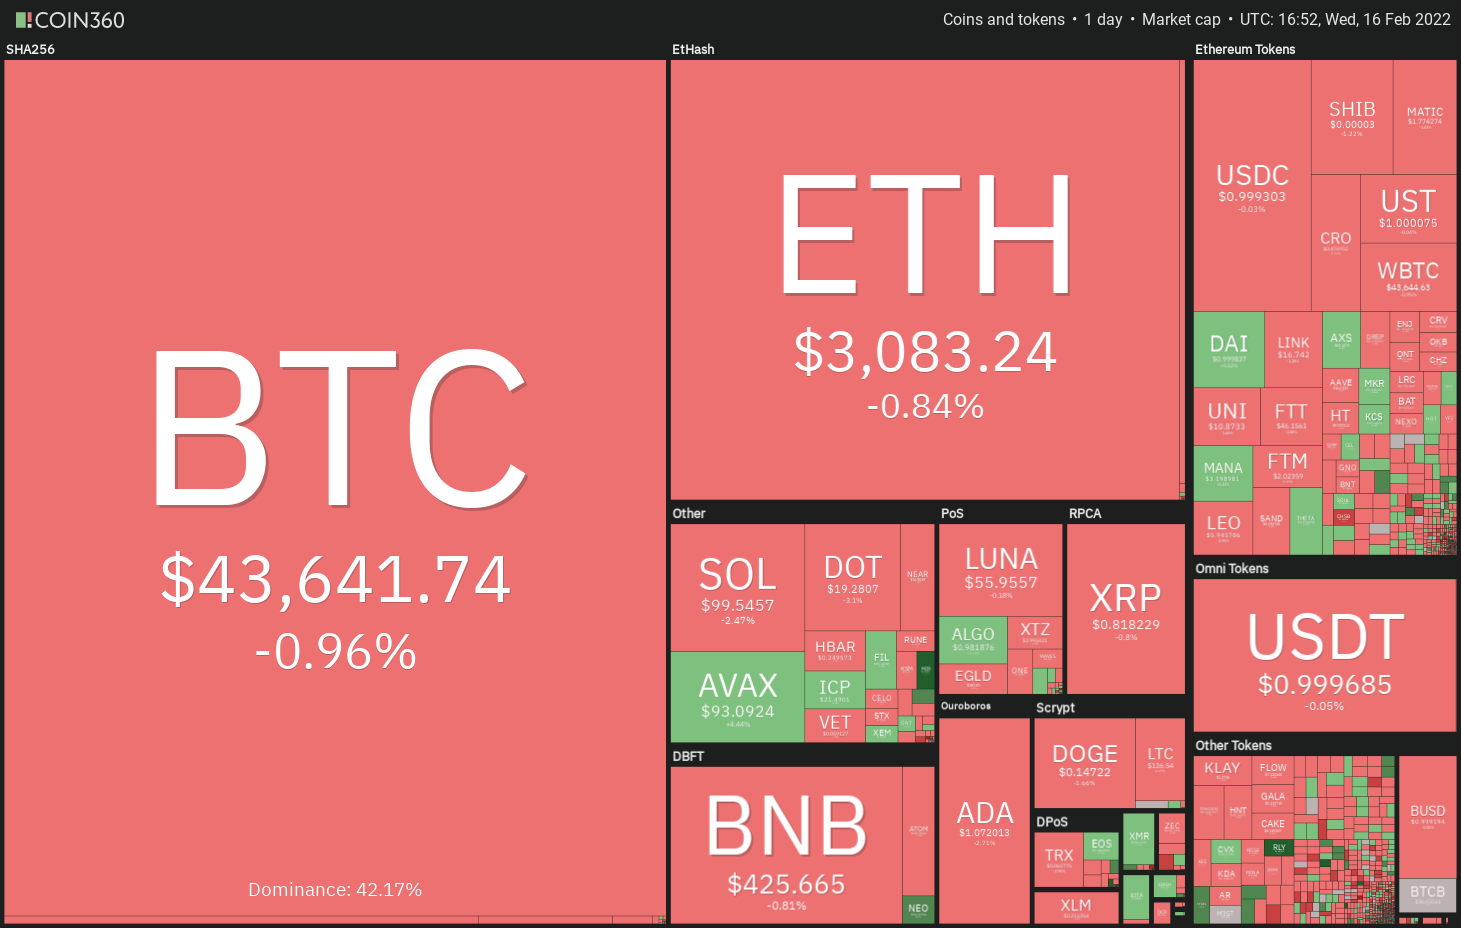 Daily cryptocurrency market performance. Source: Coin360
JPMorgan has opened a virtual lounge in Decentraland’s Metajuku Mall, taking the first step into the metaverse, which the bank believes will present a $1-trillion opportunity.
Even Warren Buffet, who has been a vocal critic of Bitcoin until now, seems to be warming up to the fintech sector. Berkshire Hathaway’s security filing shows that the firm has increased its holdings in Nubank, the largest fintech bank in Brazil and reduced exposure in Visa and Mastercard stock.
Let’s study the charts of the top-10 cryptocurrencies to determine the near-term price action.
BTC/USDT
Bitcoin bounced off the 20-day exponential moving average (EMA) ($41,938) on Feb. 14 but the bulls could not push the price to the overhead resistance at $45,821. This suggests that higher levels continue to attract selling.
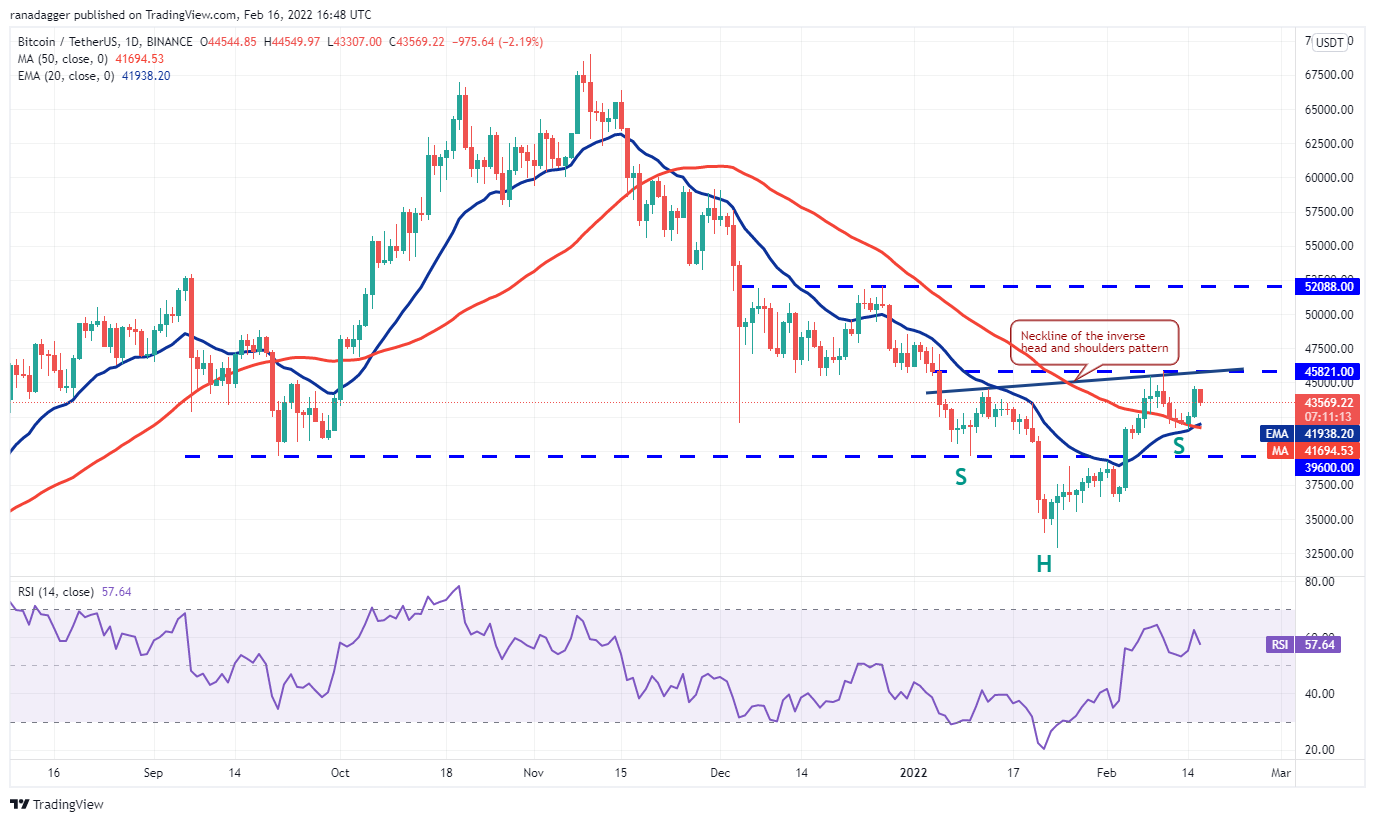 BTC/USDT daily chart. Source: TradingView
The moving averages have completed a bullish crossover and the relative strength index (RSI) is in the positive territory, indicating that the sentiment is positive. The bulls are likely to buy the dips to the 20-day EMA.
If the price turns up from the current level or rebounds off the 20-day EMA, the buyers will attempt to drive the price above the neckline of the inverse head and shoulders (H&S) pattern. If they succeed, the bullish setup will complete, signaling a possible reversal.
Contrary to this assumption, if the price breaks below the 20-day EMA, the BTC/USDT pair could drop to $39,600. This is a critical level for the bulls to defend because a break below it could intensify selling.
ETH/USDT
Ether (ETH) broke and closed above the moving averages on Feb. 15, but the bulls are struggling to sustain the price above the 50-day simple moving average (SMA) ($3,068). This indicates that bears continue to sell on rallies.
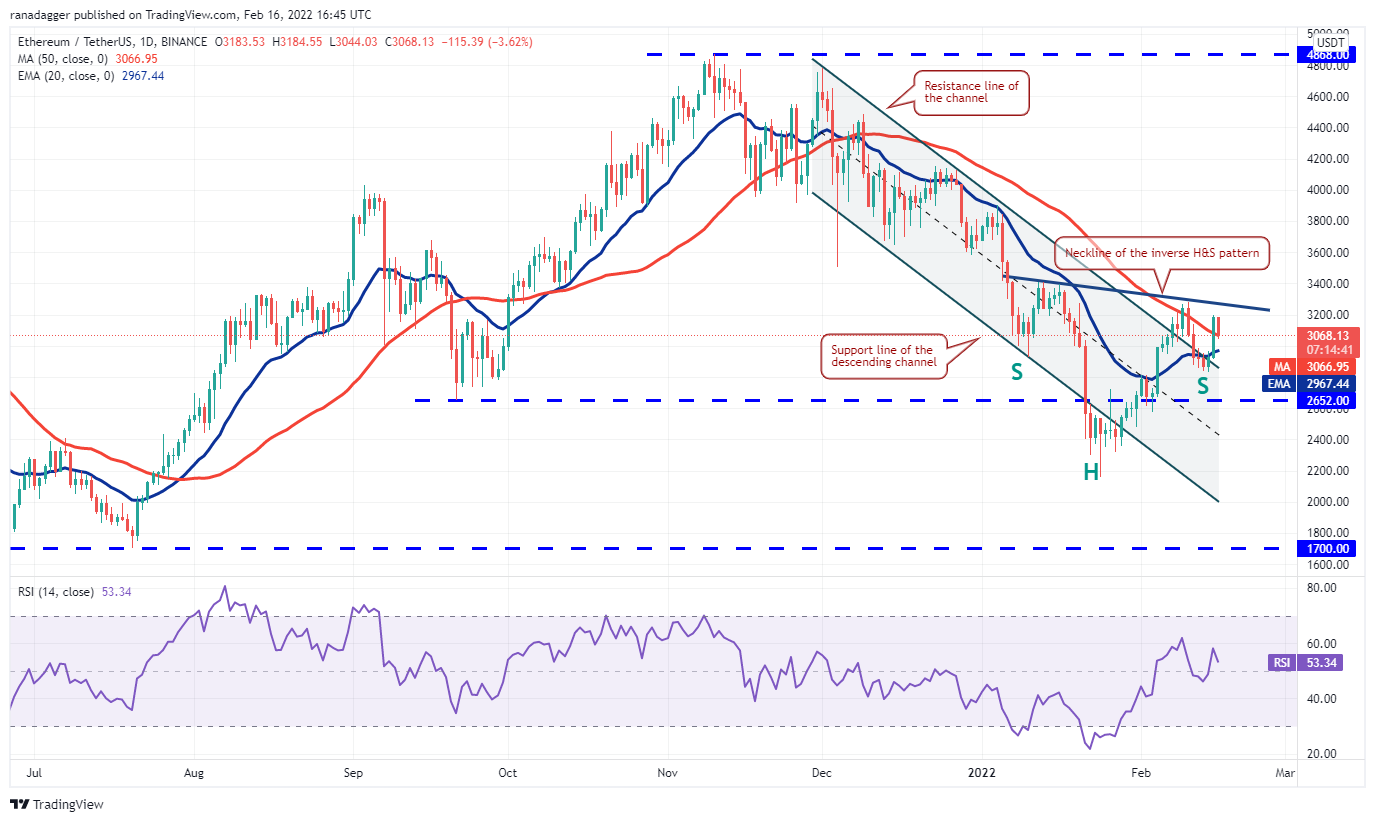 ETH/USDT daily chart. Source: TradingView
The sellers will now try to pull the price back below the moving averages. If they succeed, the ETH/USDT pair could drop to the strong support at $2,652.
Conversely, if the price rebounds off the moving averages, it will suggest that traders are accumulating on dips. The bulls will then again attempt to drive the price above $3,283.66. A close above this level will complete an inverse H&S pattern, which will indicate the start of a possible up-move. The pair could then rally to $4,000.
BNB/USDT
Binance Coin (BNB) soared above the 20-day EMA ($410) and the downtrend line on Feb. 15 but the bulls could not clear the hurdle at the 50-day SMA ($434).
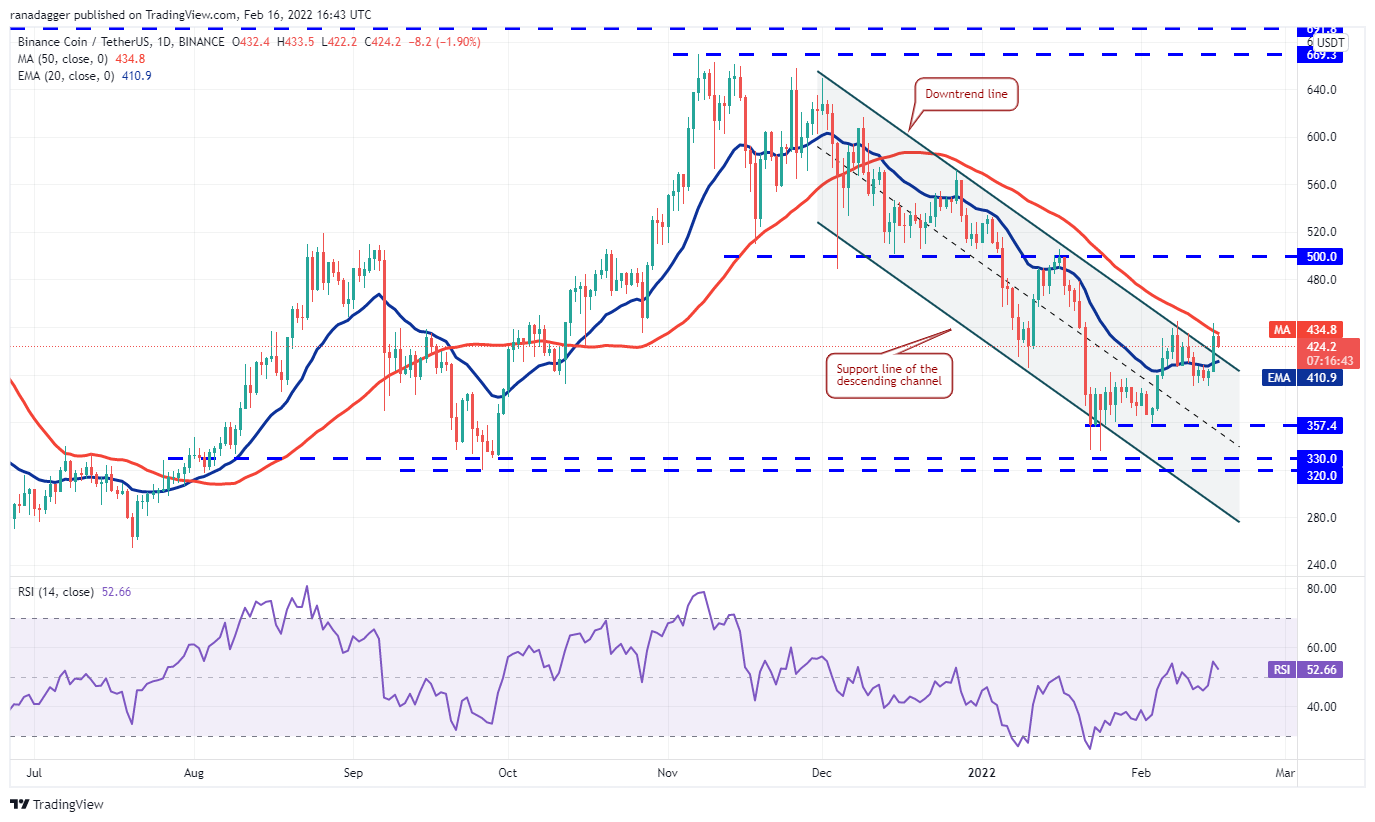 BNB/USDT daily chart. Source: TradingView
The bears are trying to defend the 50-day SMA and pull the price back below the 20-day EMA. If they manage to do that, the aggressive bulls could get trapped and the BNB/USDT pair may drop to $390.60.
On the other hand, if the price rebounds off the 20-day EMA, it will suggest that the sentiment has turned from sell on rallies to buy on dips. That could increase the possibility of a break above the 50-day SMA. If that happens, the pair may start a rally to the overhead resistance at $500.
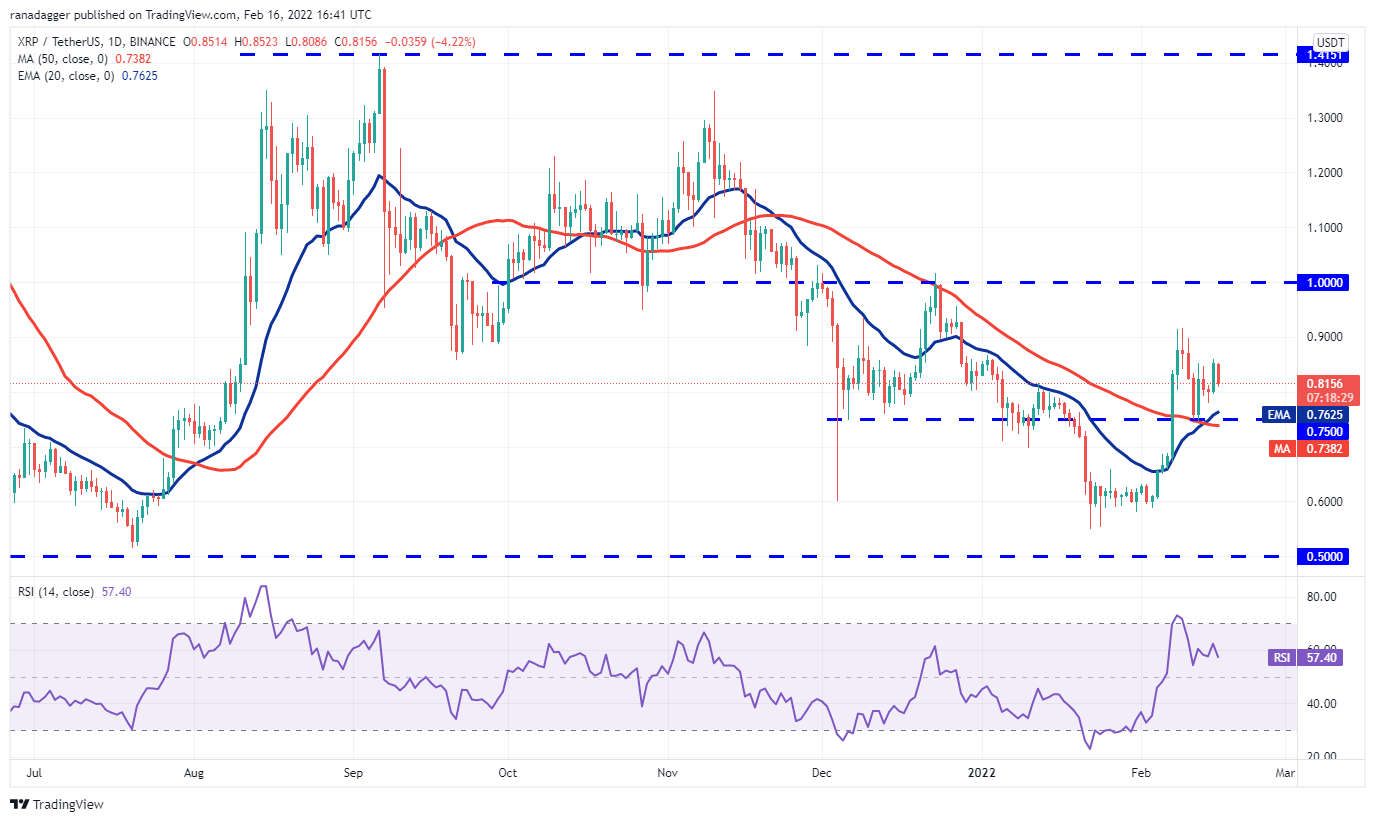
XRP/USDT
Ripple (XRP) is facing stiff resistance near $0.85 for the past few days. The bears will now try to pull the price to the breakout level at $0.75.
 XRP/USDT daily chart. Source: TradingView
The moving averages have completed a bullish crossover and the RSI is in the positive zone, indicating that bulls have a slight edge. The buyers are likely to defend the 20-day EMA ($0.76) aggressively.
If the price rebounds off this level, the bulls will again attempt to clear the overhead barrier at $0.85. If that happens, the XRP/USDT pair could rise to $0.91 and later to the psychological level at $1. This positive view will invalidate if bears sink and sustain the price below $0.75.
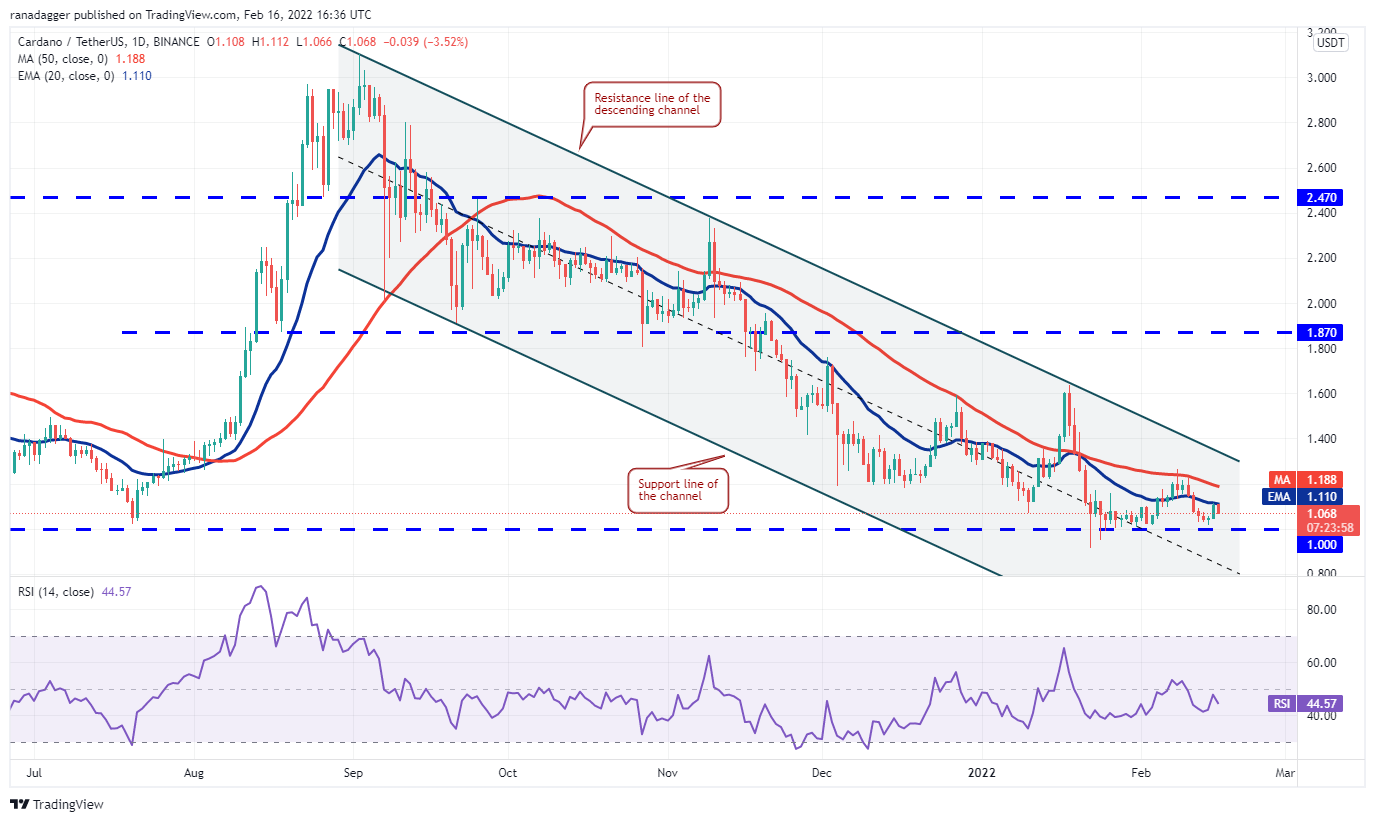
ADA/USDT
Cardano (ADA) bounced off the $1 support on Feb. 14 and reached the 20-day EMA ($1.11) on Feb. 15. The bears are unwilling to let go of their advantage and are defending this level aggressively.
 ADA/USDT daily chart. Source: TradingView
If the price remains below the 20-day EMA, the sellers will make one more attempt to sink and sustain the ADA/USDT pair below the critical support at $1. Frequent retests of a support level tend to weaken it. If the support cracks, the selling could intensify and the pair could plummet to $0.80.
Conversely, if the price turns up from the current level or $1 and breaks above the moving averages, the pair could reach the resistance line of the channel. The bulls will have to clear this hurdle to signal the start of a new trend.
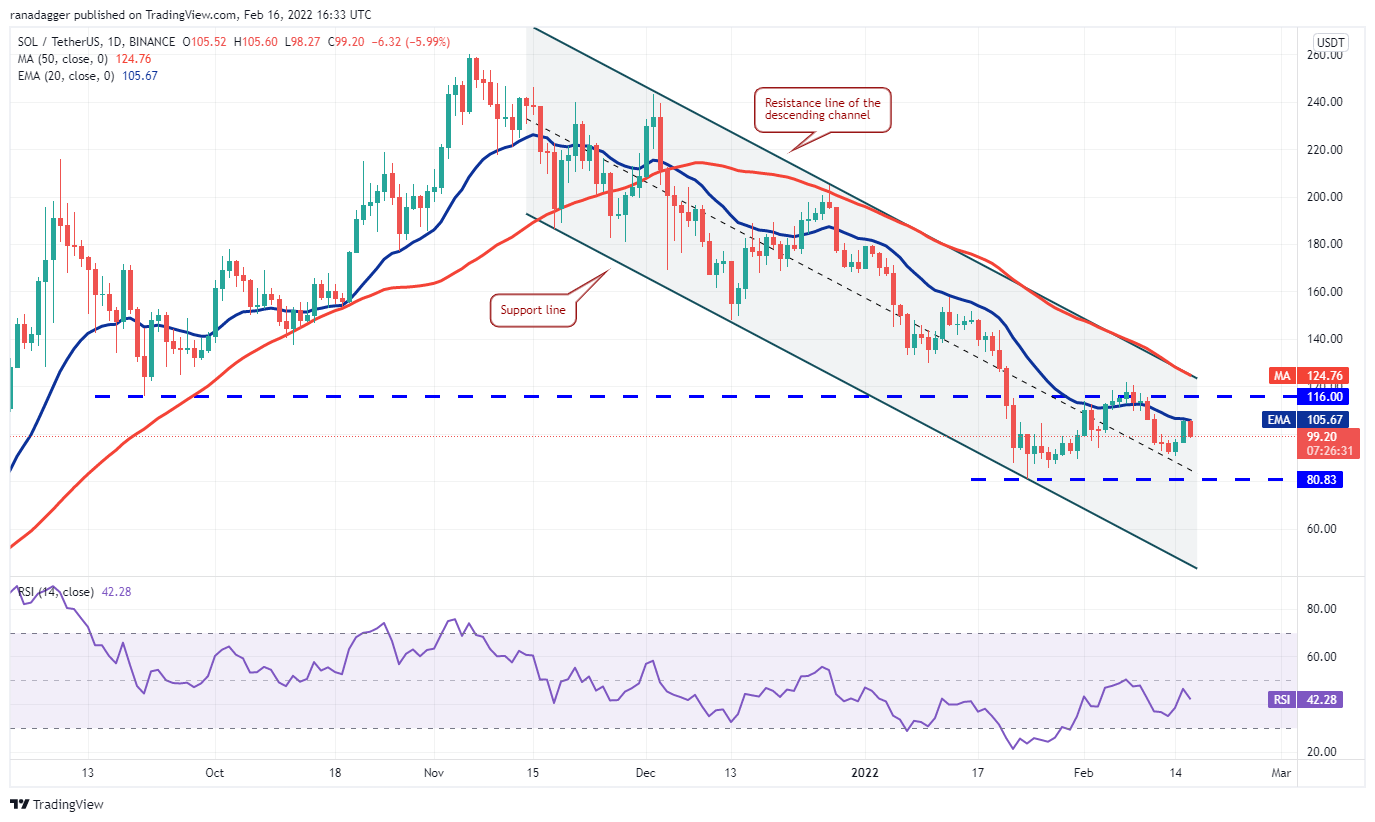
SOL/USDT
Solana (SOL) bounced on Feb. 14 and reached the 20-day EMA ($105) on Feb. 15 but the bulls are facing stiff resistance from the bears at this level. This indicates that the sentiment remains negative and traders are selling on rallies.
 SOL/USDT daily chart. Source: TradingView
The 20-day EMA has started to turn down and the RSI is below 43, suggesting that bears have the upper hand. If the selling pressure continues, the SOL/USDT pair could drop to the strong support at $80.83.
The bulls are likely to defend this support with vigor. If the price rebounds off this level, the pair could consolidate between $80.83 and $116 for a few days.
If the price turns up from the current level and breaks above the 20-day EMA, the pair could rally to the resistance line of the channel. A break and close above the channel will indicate that the downtrend could be over.
AVAX/USDT
Avalanche (AVAX) bounced off the uptrend line on Feb. 14 and surged to the downtrend line on Feb. 15. The bulls pushed the price above the downtrend line on Feb. 16 but the long wick on the candlestick shows that bears are selling at higher levels.
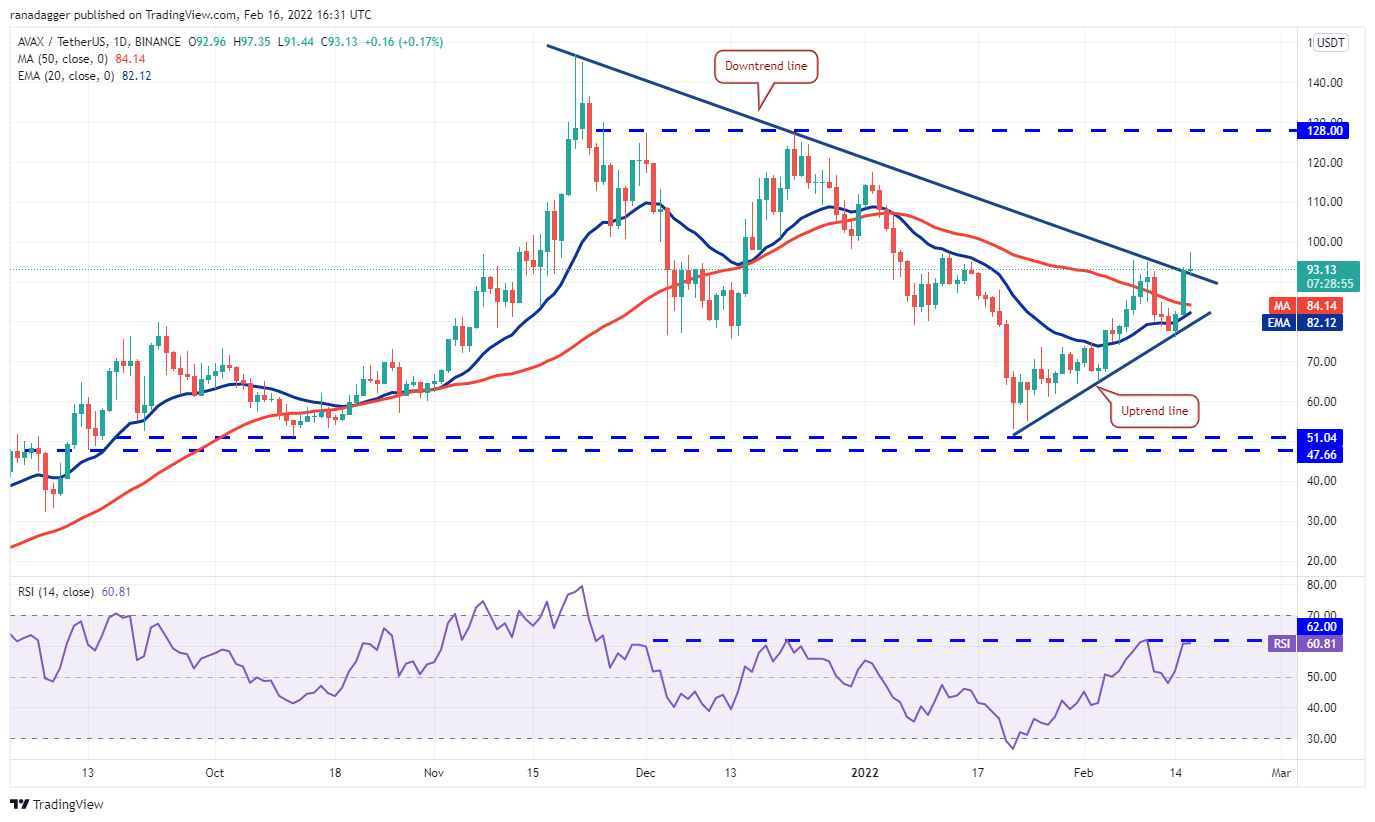 AVAX/USDT daily chart. Source: TradingView
The moving averages are close to completing a bullish crossover and the RSI is knocking on the overhead resistance near 62. This suggests that bulls have the upper hand.
If buyers sustain the price above the downtrend line, the AVAX/USDT pair could start a rally to $117.53.
Conversely, if the price turns down and breaks below the downtrend line, it will suggest that the current breakout may have been a bear trap. The pair could then again drop to the moving averages. The trend could turn in favor of the bears on a break and close below the uptrend line.
Related: Bitcoin dips before Fed rate hike cues amid warning over $9T balance sheet
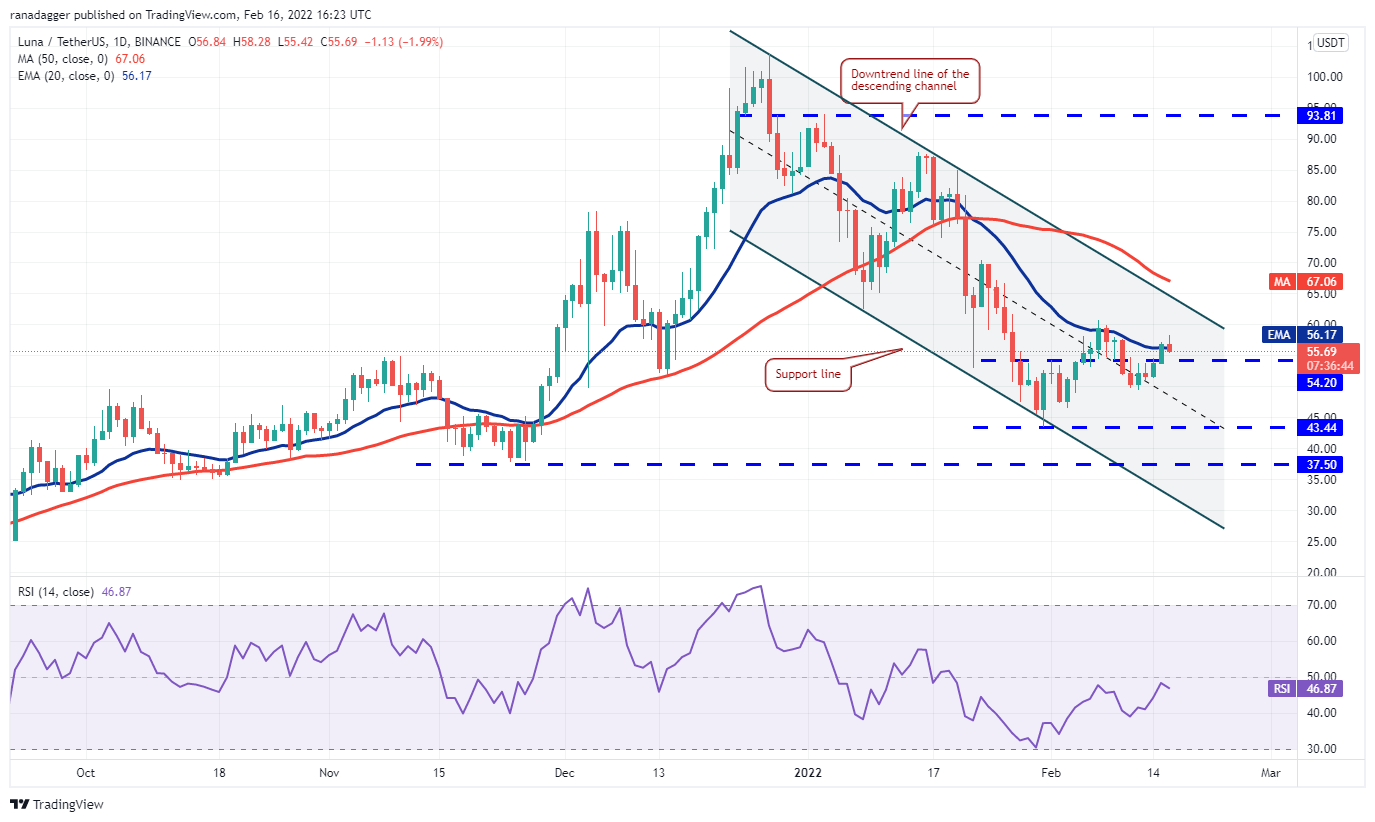
LUNA/USDT
Terra’s LUNA token broke and closed above the 20-day EMA ($56) on Feb. 15, but the bulls are struggling to sustain the higher levels. This suggests that bears continue to sell on rallies.
 LUNA/USDT daily chart. Source: TradingView
The bears have pulled the price back below the 20-day EMA and will now attempt to break the support at $54.20. If that happens, the LUNA/USDT pair could decline to $49.39. If this support also cracks, the next stop could be $43.44.
Conversely, if the price rebounds off $54.20, the pair could resume its relief rally to the downtrend line of the descending channel. The bulls will have to push and sustain the price above this resistance to indicate that the downtrend may be over.
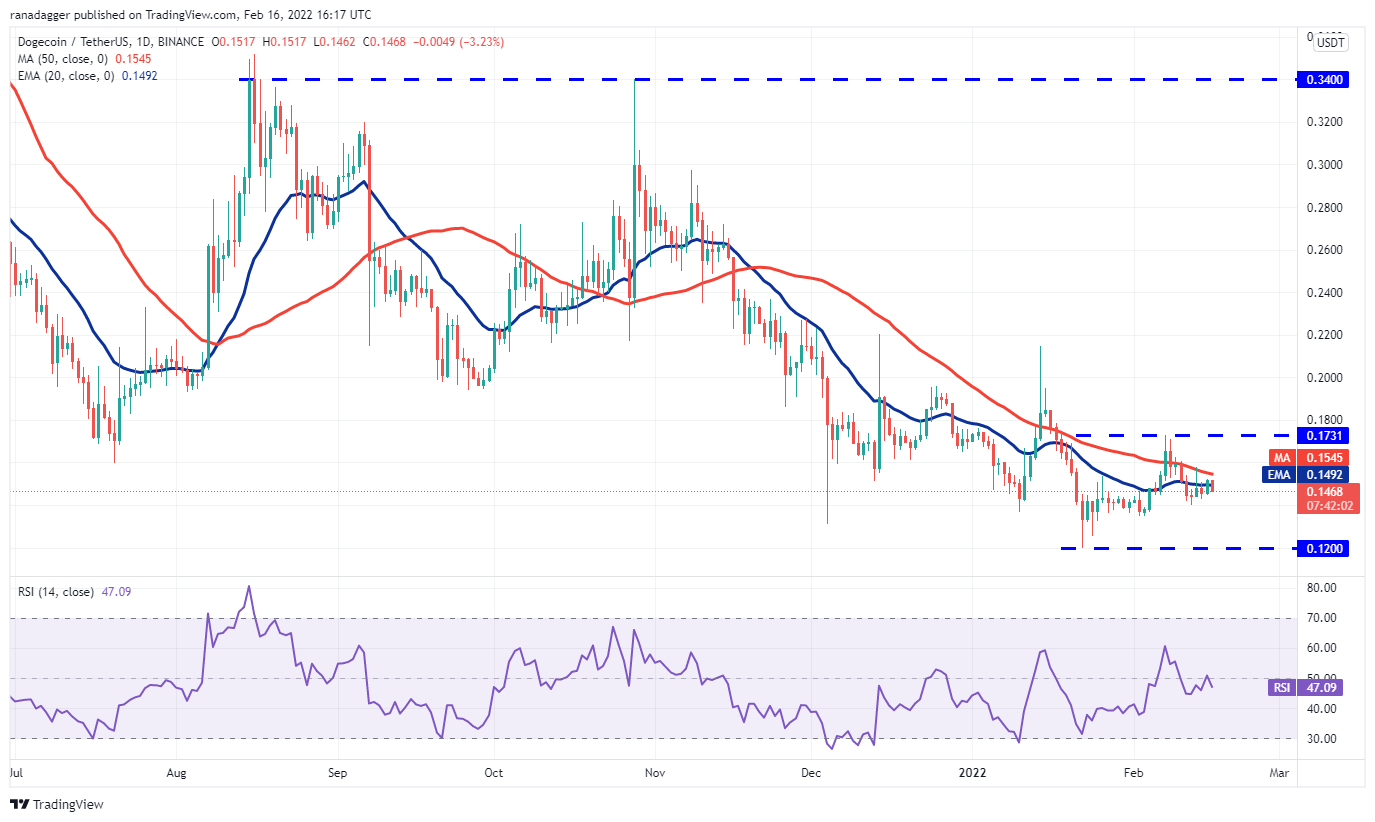
DOGE/USDT
Dogecoin (DOGE) broke and closed above the 20-day EMA ($0.14) on Feb. 15 but the recovery is again facing strong selling at the 50-day SMA ($0.15).
 DOGE/USDT daily chart. Source: TradingView
The 20-day EMA has flattened out and the RSI is just below the midpoint, indicating a balance between supply and demand. If bulls push and close the price above the 50-day SMA, the DOGE/USDT pair could challenge the overhead resistance at $0.17. If bulls clear this hurdle, the pair could pick up momentum and rally to $0.22.
On the other hand, if the price turns down from the current level and plummets below $0.14, the pair could drop to $0.13 and later to the critical support at $0.12.
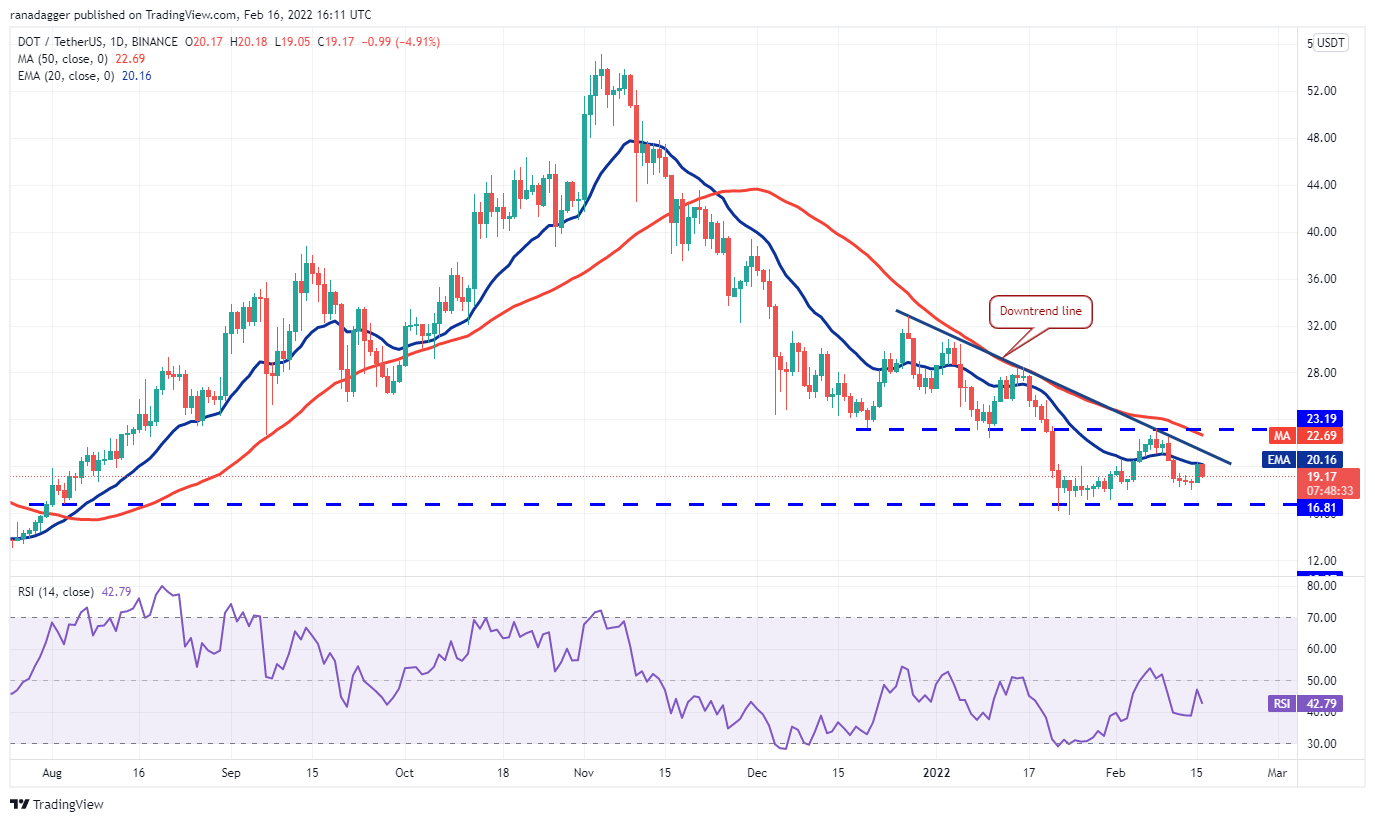
DOT/USDT
The long tail on Polkadot’s (DOT) Feb. 14 candlestick shows that bulls are buying on dips near the strong support level at $16.81. The recovery reached the 20-day EMA ($20.16) on Feb. 15 but the bulls could not clear this hurdle.
 DOT/USDT daily chart. Source: TradingView
This indicates that bears have not yet given up and are mounting a strong defense in the zone between the 20-day EMA and the downtrend line. If the price continues lower, the bears will try to pull the DOT/USDT pair below $16.81 and resume the downtrend.
Alternatively, if the price rebounds off $16.81, the pair will again attempt to break above the overhead zone and reach $23.19. A break and close above this resistance will signal a possible change in trend.
The views and opinions expressed here are solely those of the author and do not necessarily reflect the views of Cointelegraph. Every investment and trading move involves risk. You should conduct your own research when making a decision.
Market data is provided by HitBTC exchange.