Bitcoin (BTC) heads into the last week of February lower but showing signs of strength as a key support level holds.
After a nervous few days on macro and crypto markets alike, BTC/USD is below $40,000, but signs are already there that a comeback could be what starts the week off in the right direction.
The situation is far from easy — concerns over inflation, United States monetary policy and geopolitical tensions are all in play, and with them, the potential for stocks to continue suffering.
Further cues from the Federal Reserve will be hot property in the short term, with March expected to be when the first key interest rate hike is announced and delivered.
Could it all be a storm in a teacup for Bitcoin, which on a technical basis is stronger than ever?
Cointelegraph presents five factors which could influence price action in the coming days as storm clouds remain over the global economy.
Stocks lead gloomy macro week
The main story for Bitcoin traders this week comes from outside — the post-Covid economic outlook and worries over relations with Russia.
The first comes in the form of how the Fed will respond to soaring inflation, and more specifically whether its hinted interest rate hikes will start in March as anticipated.
Such hikes are bad news for booming equities, which have had two years of unbridled gains thanks to the giant liquidity program from the Fed to counter another Covid-era demon: lockdowns and unprecedented controls on economic activity.
With the “easy money” soon to start drying up, something of a reality check could be in store for everyone.
In terms of rate hikes, too many too soon risk recession — a topic already under discussion as a potential “necessary evil” for other countries — while a light touch could on the contrary fail to reduce the highest inflation in 40 years.
Coupled with that, the situation with Russia and its alleged plans for Ukraine is further worrying equities.
Commodities such as oil have been conversely profiting from fears over outright war, these so far being misplaced as diplomacy limps on this week.
Overall, however, the short-term view is one of considerable uncertainty, while optimism remains for a comeback for both risk assets such as crypto and traditional stocks by the end of 2022.
There is, however, no hiding the numbers.
“Global stocks have lost another $1.3tn in mkt cap this week on heightened Russia/Ukraine risk & the potential for continual Fed rate hikes this year,” markets commentator Holger Zschaepitz summarized Sunday.
“The latter expected to halt growth & trigger a recession by 2023H1 in the US. Stocks now worth $114tn, equal to 134% of global GDP.”
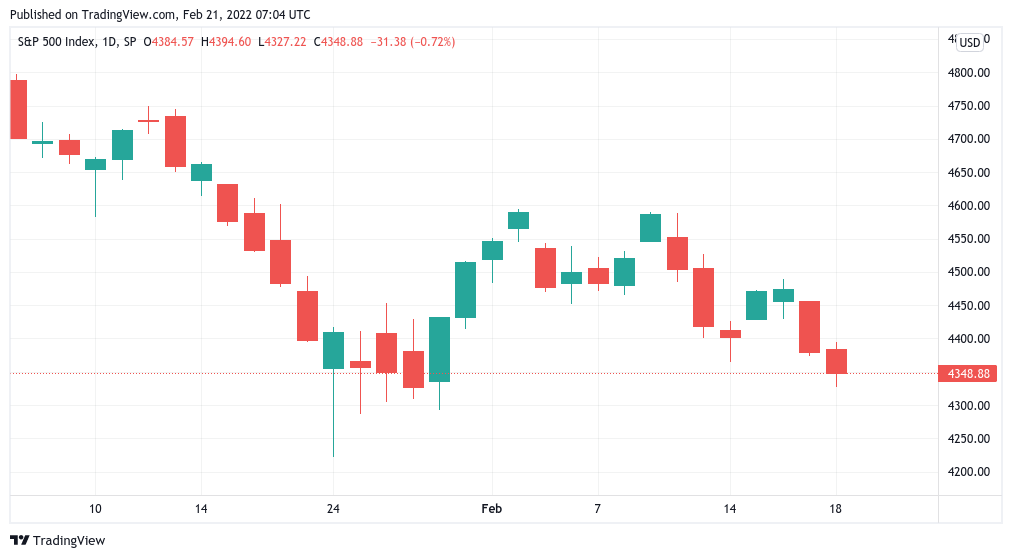 S&P 500 1-day candle chart. Source: TradingView
Wall Street trading begins on Tuesday this week due to a U.S. public holiday.
BTC price takes aim at CME futures gap
With that, it’s been tough for the average Bitcoin day trader this month.
February has afforded only around two weeks of easy gains, with macro influences putting an end to the party the week before last.
Since then, BTC/USD has lost $40,000 support and threatened a full retracement of this month’s newly-won ground.
In the event, however, $38,000 — a level previously highlighted as essential to hold for bulls — remained intact.
The weekly close, while the lowest in several weeks, was accompanied by a fresh relative strength index (RSI) breakout on the 4-hour chart, a classic signal preceding short-term price bounces.
True to form, Bitcoin then inched higher, holding around $39,200 at the time of writing.
#Bitcoin 4 hour RSI brokeout with the close
Waiting for the MACD to confirm: pic.twitter.com/J7rPoYISlU
— Matthew Hyland (@MatthewHyland_) February 21, 2022
Weekends on BTC/USD tend to be disregarded by seasoned traders due to the lack of volume exacerbating any given move. As such, the $38,000 dip could itself be something of an exaggeration of market sentiment.
What’s more, a rebound has clear targets — $40,000 as a support/resistance flip, but also Friday’s CME futures closing price of $39,860, this being above the main portion of the dip that occurred Saturday.
Watching this
Clear the lows and return back to CME close price.#Bitcoin pic.twitter.com/L6uMfhO4kO
— Livercoin (@Livercoin) February 20, 2022
Bitcoin has a habit of closing these “gaps” in the CME chart, often within days or even hours once the new week’s trading gets underway.
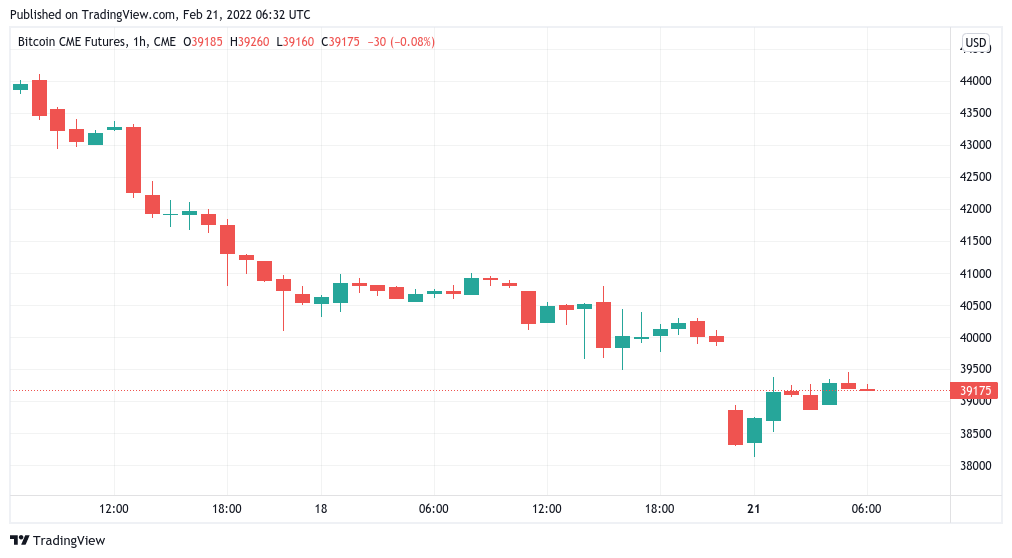 CME Bitcoin futures 1-hour candle chart. Source: TradingView
Who’s buying while you’re selling?
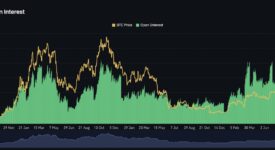
Amid disbelief that some are choosing to sell their BTC now after holding through several months of downside, data shows that big players are smelling a bargain.
Some of the largest Bitcoin wallets out there are putting their money where their mouth is — and have been doing so throughout 2022 and even before.
There are many examples, with on-chain monitoring resource BitInfoCharts showing the “up only” trend of one entity in particular.
Monday alone saw its balance increase by 150 BTC, and it’s not alone — others have been scooping up coins during this weekend’s local low.
When you panic sell your #Bitcoin, this guy buys it all.
Today, this guy bought 6 times already, $BTC worth $20 million. pic.twitter.com/8fIgCvsmpK
— C15Capital ⚡️ (@Capital15C) February 20, 2022
Small-volume holders aren’t necessarily weak hands, however. The latest figures from on-chain analytics firm Glassnode show that the number of wallets holding at least 0.01 BTC ($393) is now at an all-time high of 9.4 million.
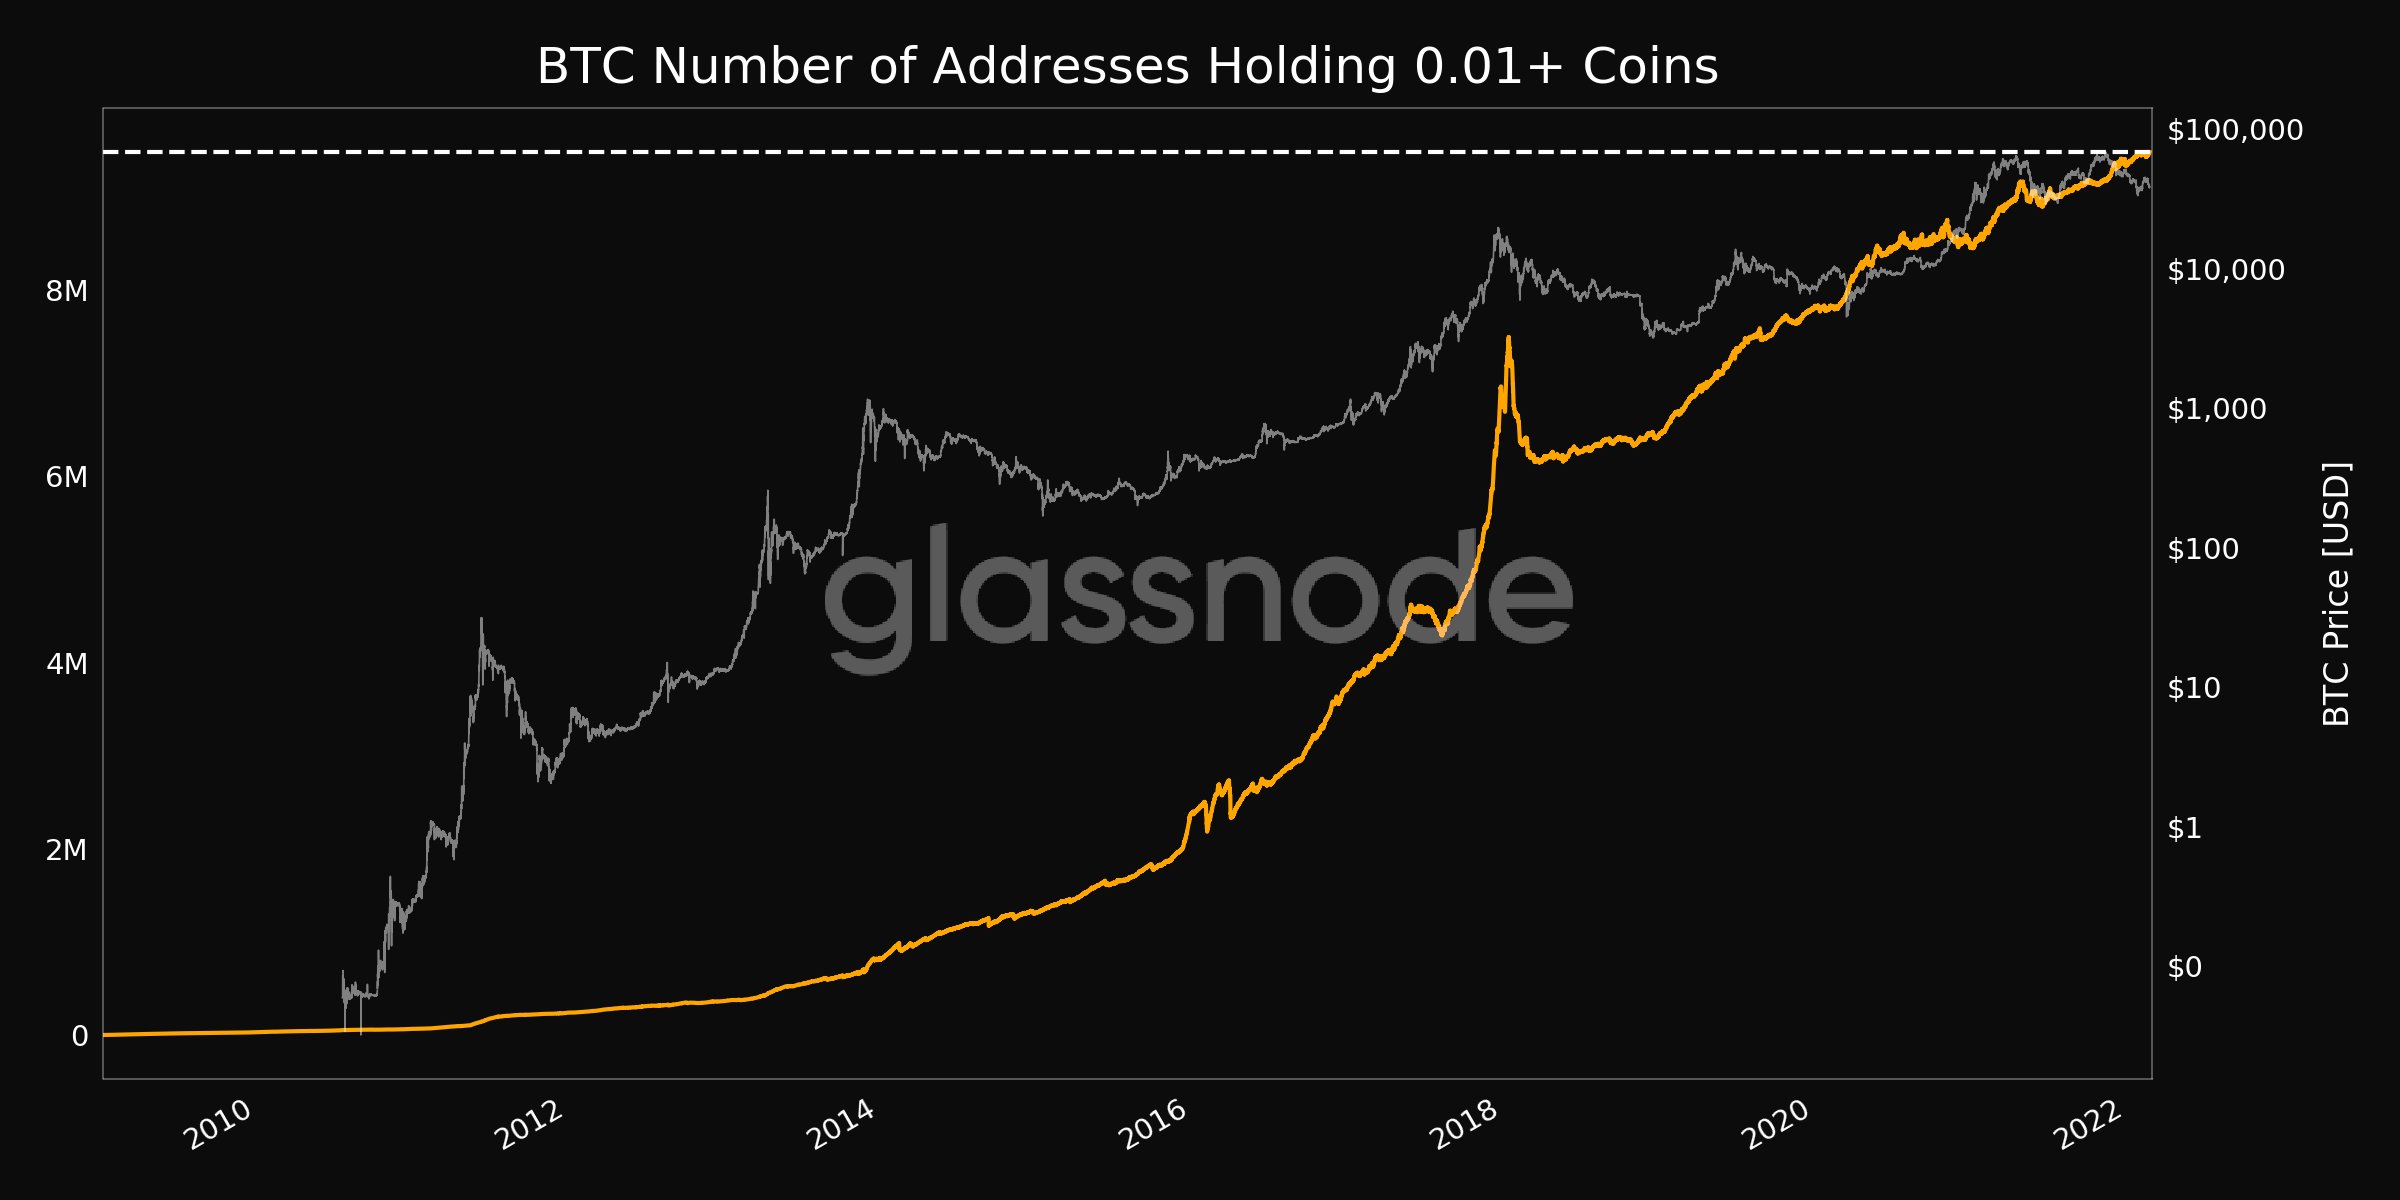 Bitcoin addresses with a balance of 0.01 BTC or more. Source: Glassnode/ Twitter
The last peak was in fact in late January before Bitcoin’s latest uptick to $45,500.
As Cointelegraph further reported at the weekend, the BTC supply is becoming increasingly illiquid overall, with the proportion dormant for at least one year approaching record highs.
Coin days destroyed hints at possible bottom
Those looking for signs that $38,000 was the local floor need not in fact look too far.
Thanks to on-chain data analysis, it can now be seen that long-term Bitcoin investors repeated behavior over the weekend which accompanied the July 2021 and September 2021 BTC price bottoms.
The data set, this time from CryptoQuant, governs “coin days destroyed” — the cumulative number of days since each BTC last moved on a given day.
The weekend saw a significant number of “older” coins on the move, thus “destroying” the largest number of dormant days since the July 2021 bottom below $30,000.
In terms of raw numbers, CDD was the highest since July 2019 — although the event at that time accompanied a local top, rather than a bottom.
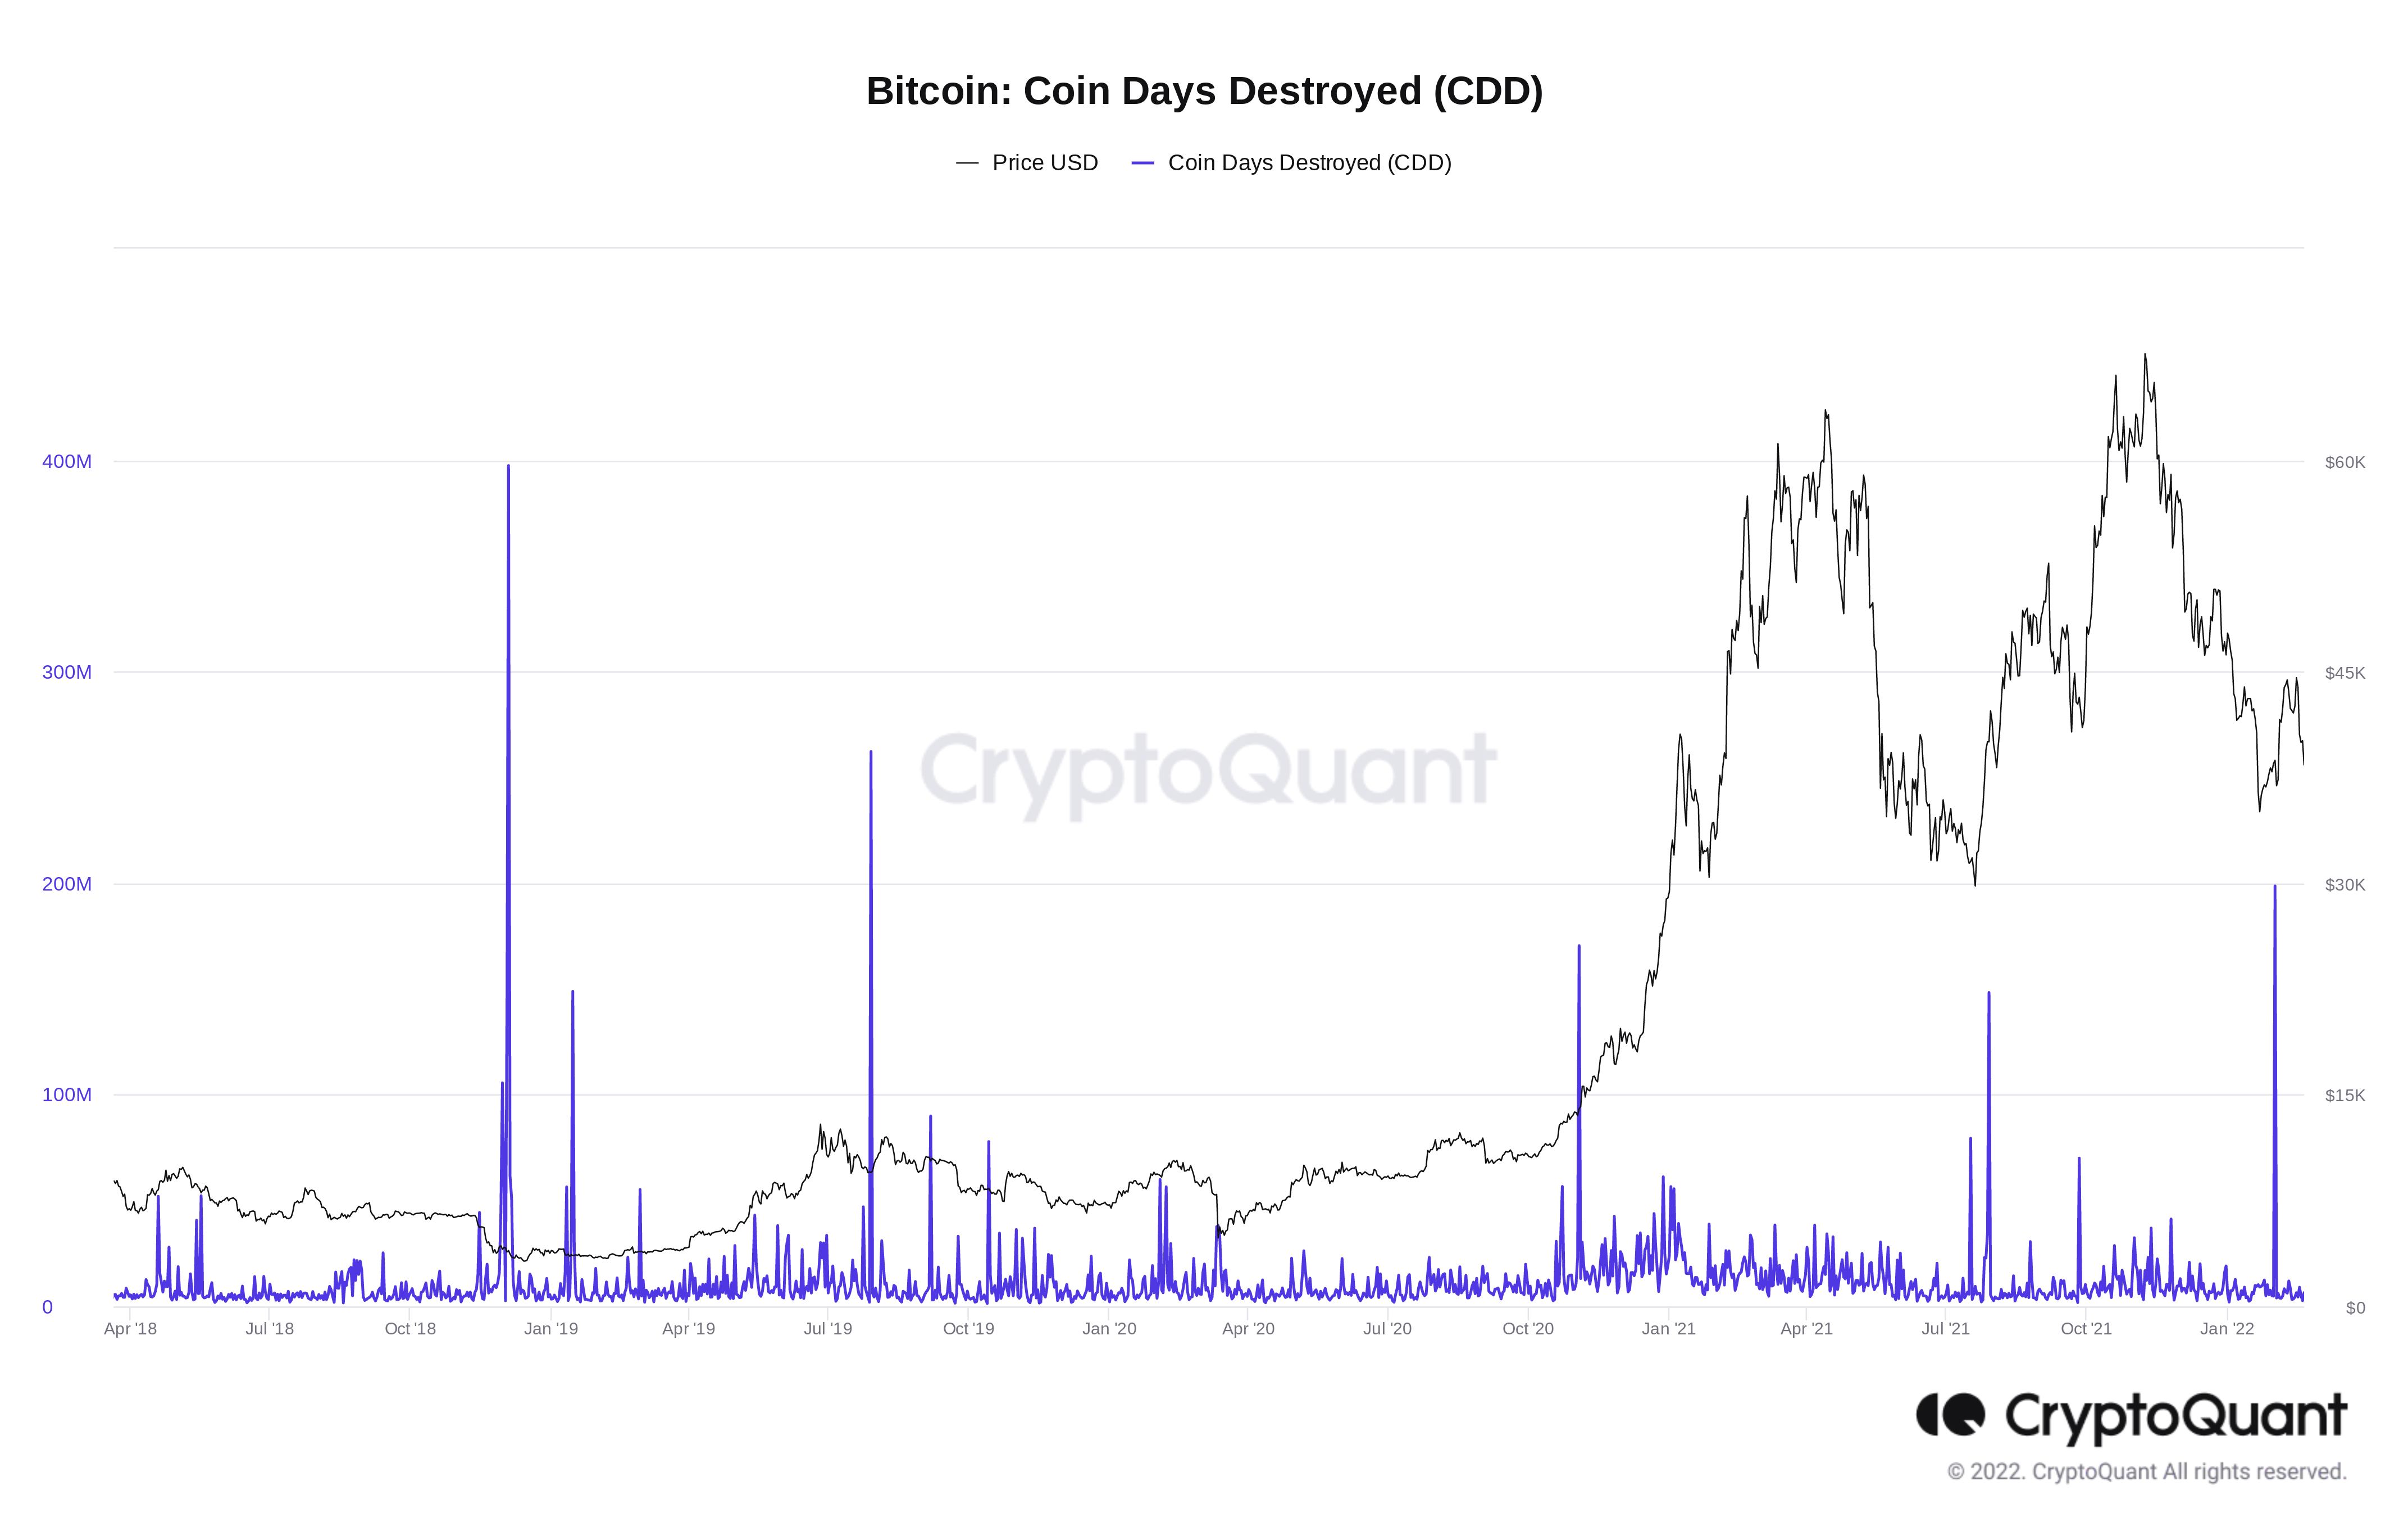 Bitcoin coin days destroyed (CDD) chart. Source: CryptoQuant
The phenomenon was noted by CryptoQuant contributor IT Tech, who also highlighted another on-chain metric governing hodlers flagging a price downmove.
#Bitcoin I found something really interesting. Before price pullback some of Long Term HODLers moved their $BTC because LTH-SOPR spiked twice today. Each time after this event price go down. CDD showed also big spike. What is CDD and LTH-SOPR – read tweets below. pic.twitter.com/HaPLgbkUjh
— IT Tech (@IT_Tech_PL) February 20, 2022
Reacting, popular Twitter account PlanC suggested that the two could form a leading indicator for Bitcoin going forward.
“Extreme fear” is back
With all the influencing factors, it is arguably no surprise that crypto market participants do not know quite how to feel about the outlook.
Related: Top 5 cryptocurrencies to watch this week: BTC, LEO, MANA, KLAY, XTZ
The Crypto Fear & Greed Index, the popular sentiment gauge which attempts to quantify the market’s emotions, agrees.
Bouncing around under $40,000, overall sentiment has been flirting with a return to the “extreme fear” zone, only to reenter it even as Bitcoin spot price action actually ticked higher.
As of Monday, the Index measures 25/100 — the “highest” possible extreme fear reading, but one which is over 50% lower than the “neutral” level seen just four days ago.
Fear & Greed has seen much deeper floors this year, and a definitive reversal was throughout to have entered in January when it neared historic lows of 9/100.
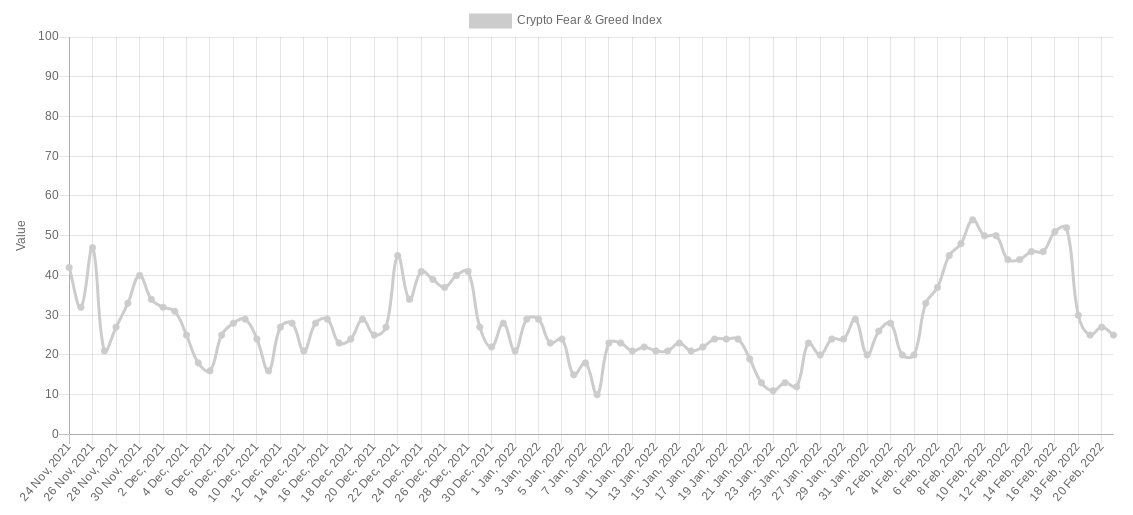 Crypto Fear & Greed Index (screenshot). Source: Alternative.me