Welcome to a weekly series where I break down and compare some of the most popular exchange-traded funds (ETFs) available to Canadian investors!
The energy sector outperformed in 2021 and 2022 thanks to high inflation and soaring commodity prices. Both BlackRock and BMO Global Asset Management provide a set of low-cost, high-liquidity ETFs that offer exposure to a portfolio of TSX energy sector stocks.
The two tickers up for consideration today are iShares S&P/TX Capped Energy Index ETF (TSX:XEG) and BMO Equal Weight Oil & Gas Index ETF (TSX:ZEO). Which one is the better option? Keep reading to find out.
XEG vs. ZEO: Fees
The fee charged by an ETF is expressed as the management expense ratio (MER). This is the percentage that is deducted from the ETF’s net asset value (NAV) over time and is calculated on an annual basis. For example, an MER of 0.50% means that for every $10,000 invested, the ETF charges a fee of $50 annually.
XEG has an MER of 0.61%, identical to ZEO. The ETFs are therefore tied when it comes to their fees, with both costing you about $61 annually on a $10,000 portfolio.
XEG vs. ZEO: Size
The size of an ETF is very important. Funds with small assets under management (AUM) may have poor liquidity, low trading volume, high bid-ask spreads, and more risk of being delisted due to lack of interest.
XEG has attracted AUM of $2.15 billion, whereas ZEO has AUM of $253 million. Although both are sufficient for a buy-and-hold investor, XEG is currently the more popular ETF among Canadian investors.
XEG vs. ZEO: Holdings
XEG tracks the S&P/TSX Capped Energy Index, which tracks the performance of 22 TSX energy stocks. Each stock in XEG is subjected to a 25% cap on their weight. The top five holdings of XEG include Canadian Natural Resources, Suncor Energy, Cenovus Energy, Tourmaline Oil, and Imperial Oil, with the first two stocks at 24.89% and 24.07% each.
ZEO tracks the Solactive Equal Weight Canada Oil & Gas Index, which tracks the performance of 10 TSX energy stocks. ZEO is equally allocated between 10 stocks, which include Canadian Natural Resources, Suncor Energy, Cenovus Energy, Tourmaline Oil, Imperial Oil, Arc Resources, TC Energy, Pembina Pipeline, Enbridge, and Keyera.
XEG vs. ZEO: Historical performance
A cautionary statement before we dive in: past performance is no guarantee of future results, which can and will vary. The portfolio returns presented below are hypothetical and backtested. The returns do not reflect trading costs, transaction fees, or taxes, which can cause drag.
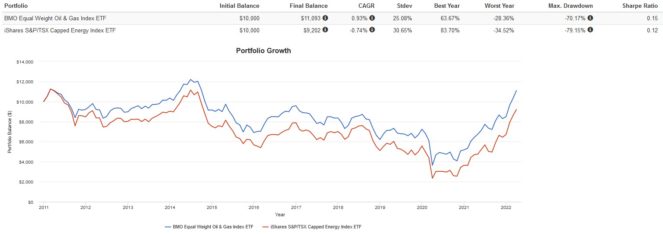
Here are the trailing returns from 2011 to present:
Here are the annual returns from 2011 to present:
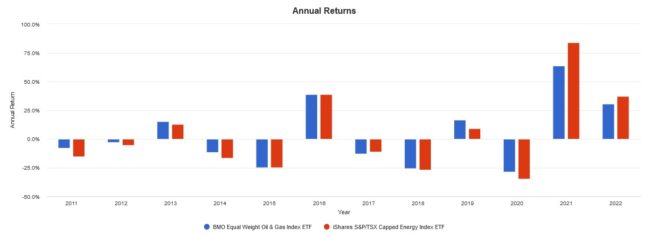
ZEO outperformed XEG over the last decade. I attribute this to ZEO’s equal weighting, which reduced the risk of a single large holding tanking its performance. XEG is way too concentrated with 50% of its holdings in just two stocks, which makes it more volatile, especially during crashes.
The Foolish takeaway
If I had to choose one ETF to buy and hold, it would be ZEO. Both ETFs have identical MERs, XEG has more AUM, but when it comes to holdings, I feel more comfortable buying an equal-weighted ETF, especially when it comes to a cyclical sector like energy.
XEG poses too much concentration risk, as half of the ETF is basically Suncor Energy and Canadian Natural Resources. When I buy a sector specific ETF, I want to own the sector and not just a few select companies. For this reason, ZEO is my pick for betting on the TSX energy sector.