Bitcoin (BTC) is facing a challenging environment in 2022 due to the surging inflation and geopolitical turmoil. Although gold has outperformed Bitcoin year-to-date, Bloomberg Intelligence senior commodity strategist Mike McGlone believes that Bitcoin could make a strong comeback. McGlone expects the current circumstances to “mark another milestone in Bitcoin’s maturation.”
Another bullish sign for the long term is that the Bitcoin miners have been increasing their Bitcoin holdings since 2021. Compass Mining founder and CEO Whit Gibbs said to Cointelegraph that Bitcoin mining companies are “taking more of a bullish approach to Bitcoin.”
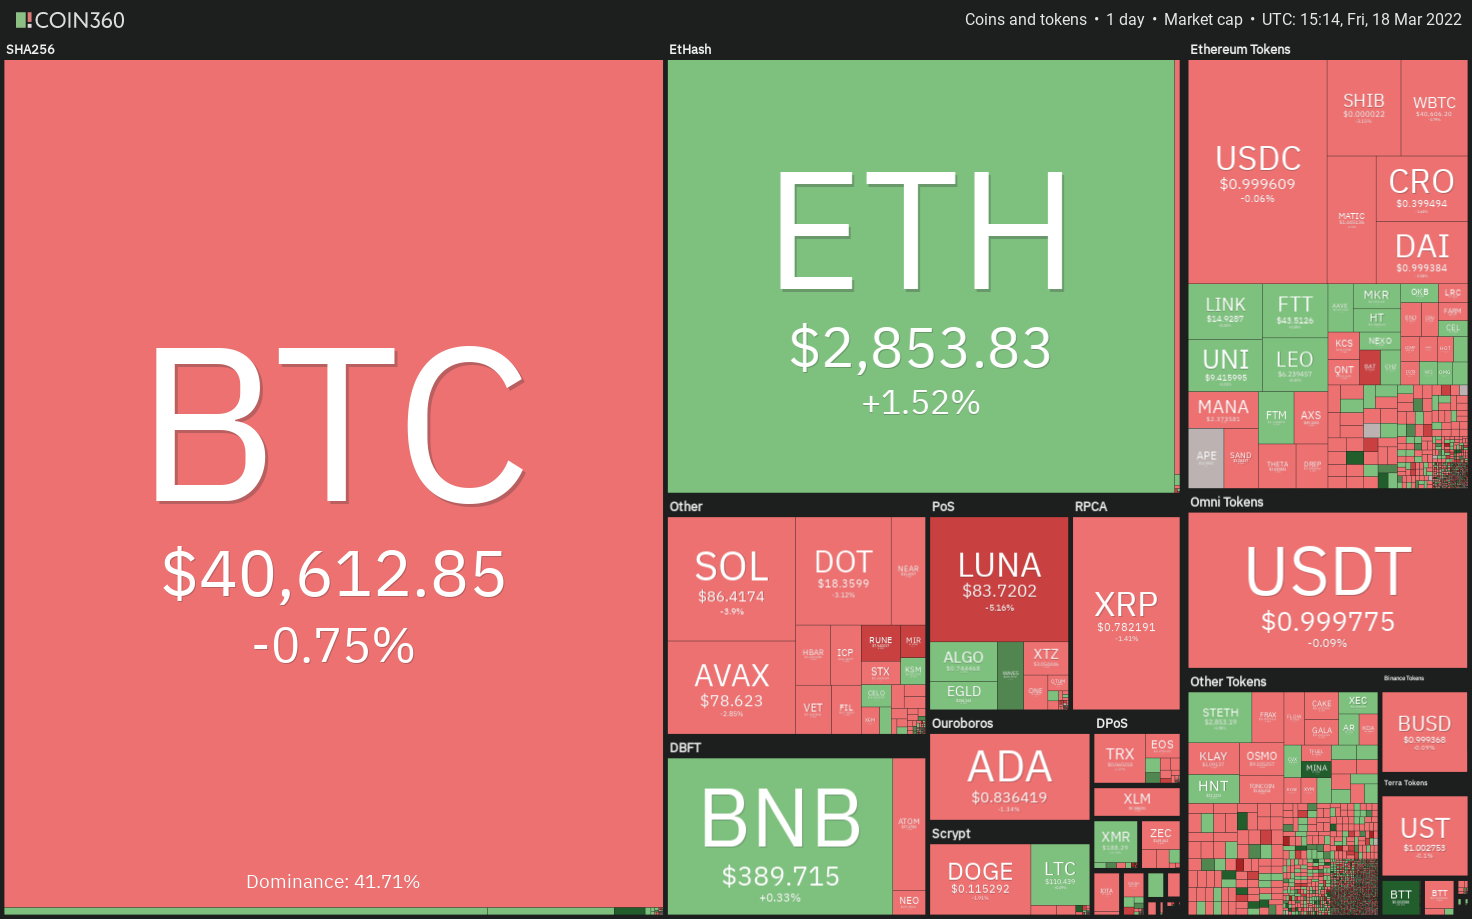 Daily cryptocurrency market performance. Source: Coin360
Terraform Labs founder Do Kwon said that its stablecoin TerraUSD (UST) will be backed by more than $10 billion in Bitcoin reserves. He expects this move to “open a new monetary era of the Bitcoin standard.”
Could Bitcoin and altcoins find buyers on dips or will bears trap the aggressive bulls? Let’s analyze the charts of the top-10 cryptocurrencies to find out.
BTC/USDT
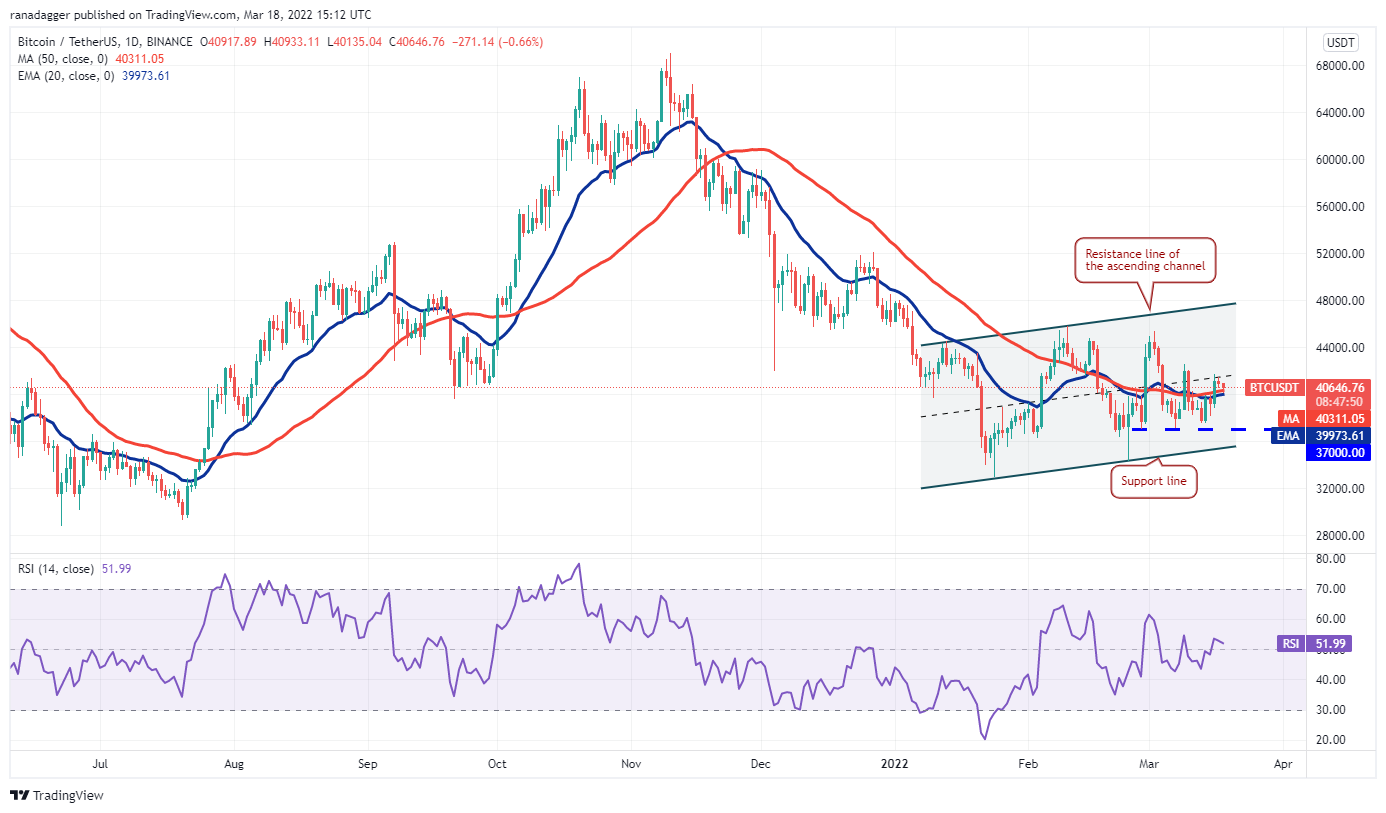
Bitcoin broke and closed above the 50-day simple moving average ($40,311) on March 16 but the bulls are struggling to build upon this breakout. This suggests that demand dries up at higher levels.
 BTC/USDT daily chart. Source: TradingView
The bears will try to make use of this opportunity and pull the price below the 20-day exponential moving average ($39,973). If they succeed, the BTC/USDT pair could again drop to the strong support at $37,000.
Conversely, if the price rebounds off the moving averages, it will suggest that the sentiment has turned positive and traders are buying on dips. The bulls will then try to push the price above $42,600 and extend the rally to $45,400.
ETH/USDT
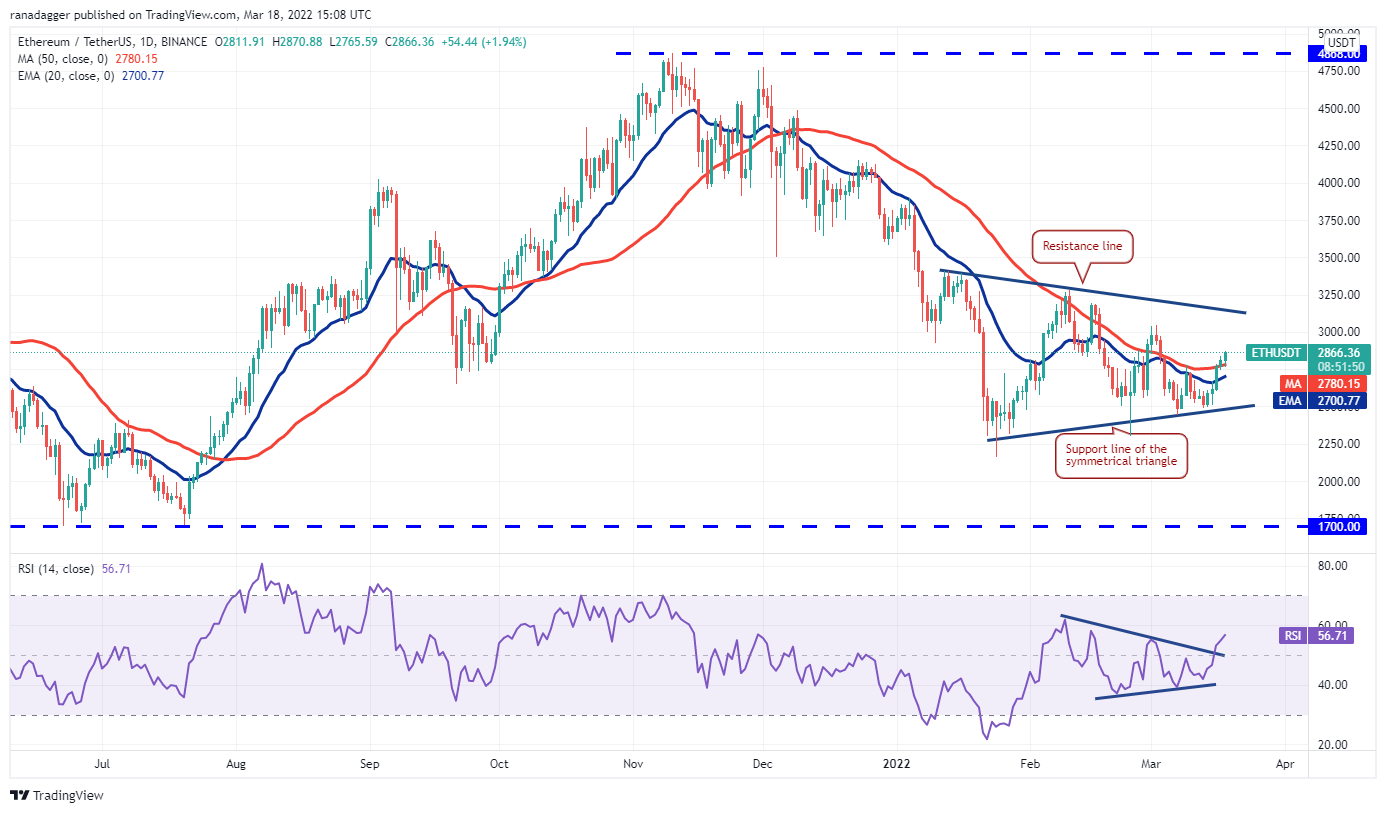
Ether (ETH) broke and closed above the 50-day SMA ($2,780) on March 16 indicating a strong comeback from the bulls. The buyers held the dip to the 50-day SMA today and are attempting to extend the recovery.
 ETH/USDT daily chart. Source: TradingView
The relative strength index (RSI) has jumped into the positive territory and the 20-day EMA ($2,700) has started to turn up, indicating the path of least resistance is to the upside. If the price sustains above the 50-day SMA, the ETH/USDT pair could rally to the resistance line of the symmetrical triangle. The bears are expected to mount a strong defense at this level.
This positive view will be invalidated if the price turns down from the current level and plummets below the moving averages. The pair could then drop to the support line of the triangle.
BNB/USDT
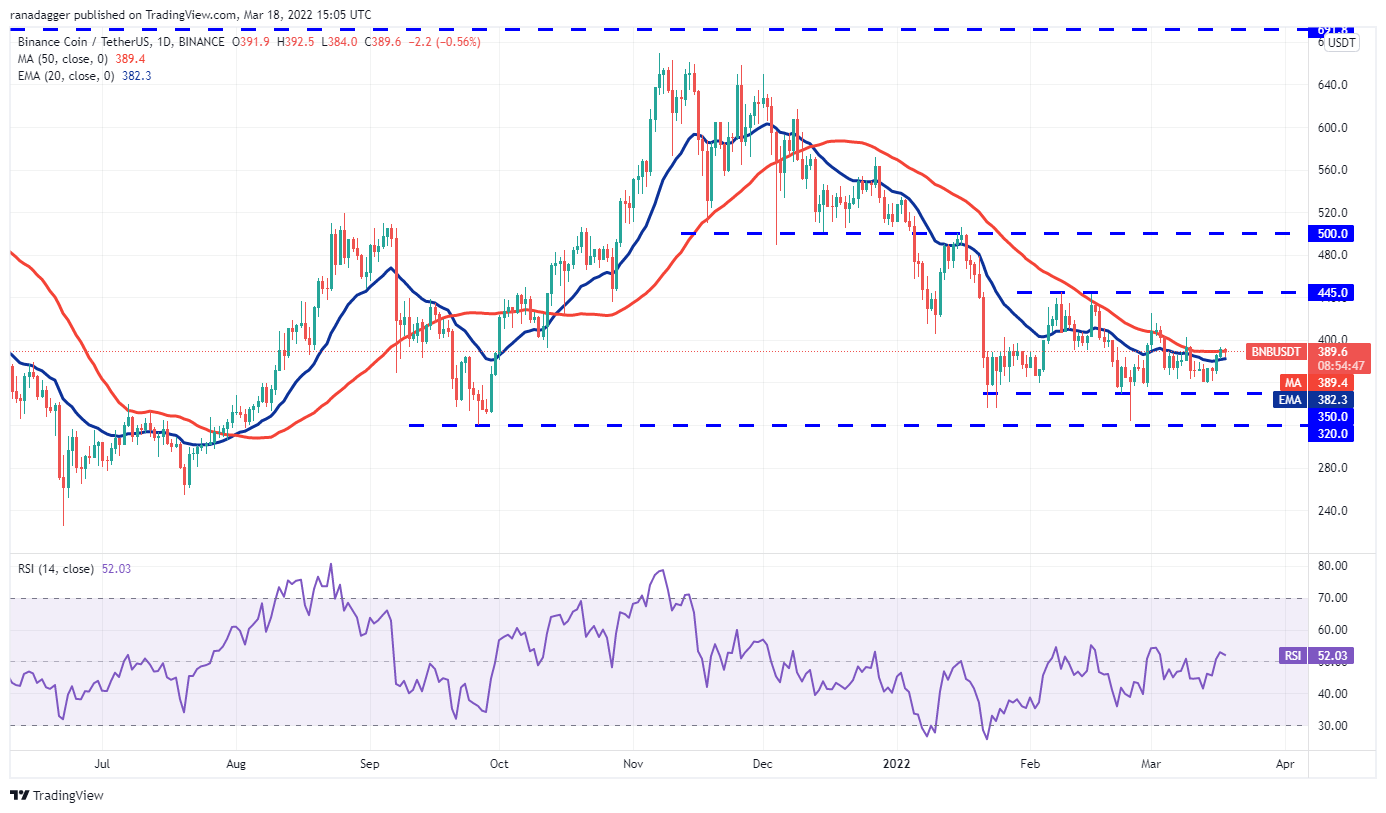
Binance Coin (BNB) is facing resistance at the 50-day SMA ($389). This is the fourth instance when the bears are posing a strong challenge at this level. Therefore, the 50-day SMA becomes a key level to watch out for on the upside.
 BNB/USDT daily chart. Source: TradingView
The flat moving averages and the RSI near the midpoint suggest a balance between supply and demand. If buyers push and sustain the price above the 50-day SMA for three consecutive days, it will indicate a possible change in trend. The BNB/USDT pair could then start its northward march toward $445.
On the other hand, if the price dips below the 20-day EMA ($382), the bears will attempt to pull the pair toward the strong support at $350.
XRP/USDT
XRP bounced off the 50-day SMA ($0.74) on March 15 but the bulls have not been able to challenge the downtrend line. This suggests that the bears are selling on rallies.
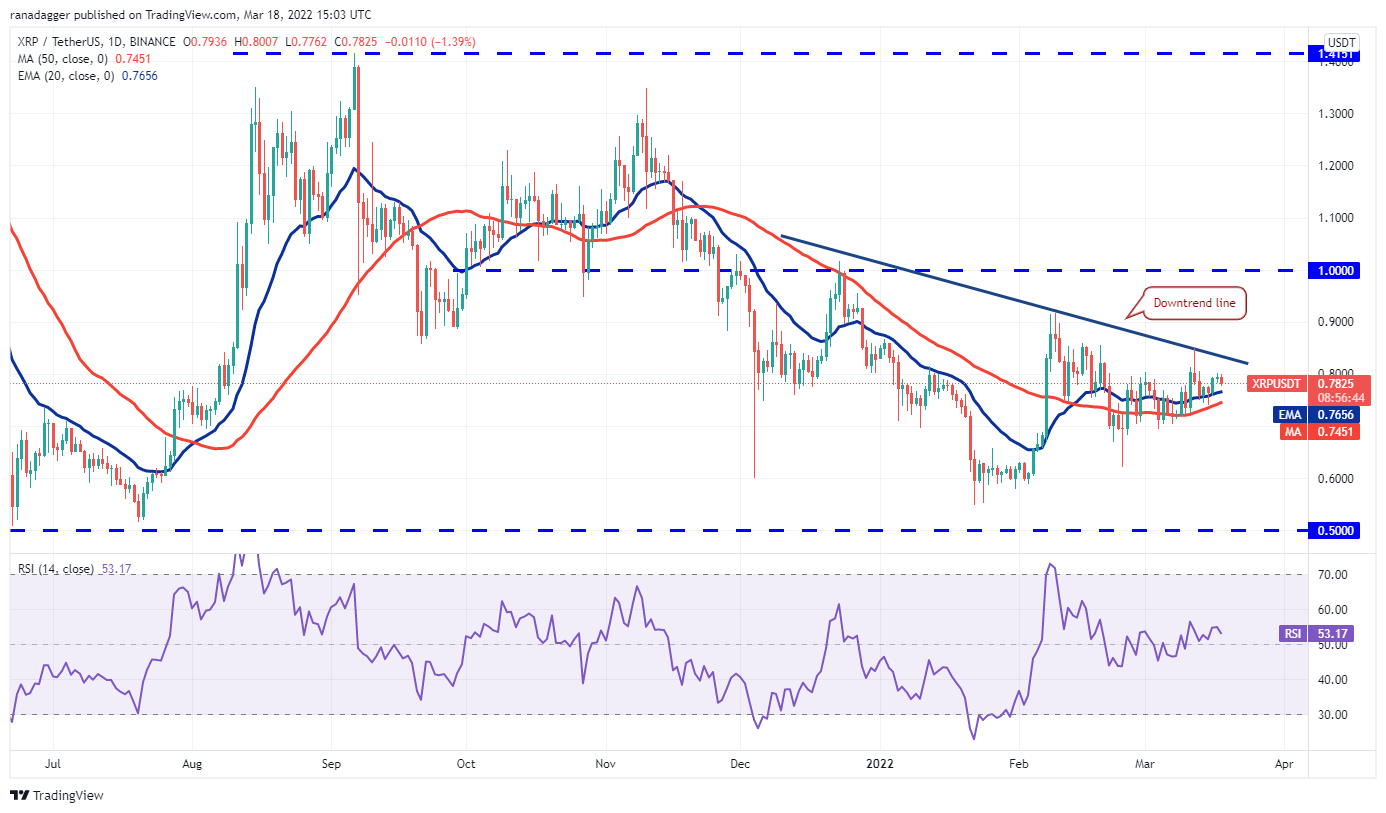 XRP/USDT daily chart. Source: TradingView
The bears will now attempt to pull the price below the moving averages. If they succeed, the XRP/USDT pair could drop to the strong support at $0.68. If this support also gives way, the decline could extend to $0.62.
Alternatively, if the price bounces off the moving averages, it will suggest that the bulls are buying on dips. That could enhance the prospects of a break and close above the downtrend line. The pair could then rally to $0.91.
LUNA/USDT
Terra’s LUNA token has broken below the 20-day EMA ($84), suggesting that the failure to sustain the price above $96 may have attracted profit-booking from the short-term traders.
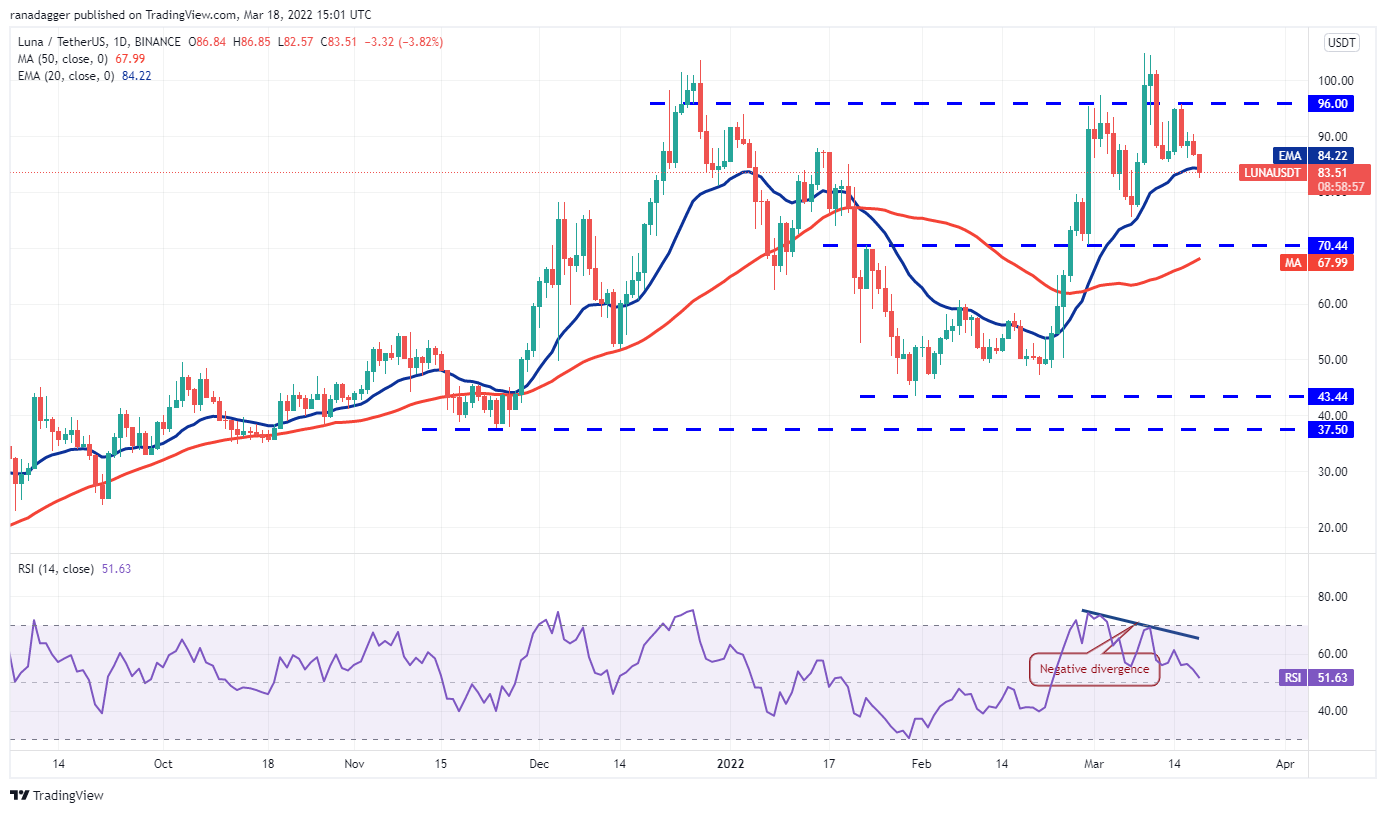 LUNA/USDT daily chart. Source: TradingView
The 20-day EMA has flattened out and the RSI has dropped to the midpoint, indicating that the bullish momentum may be waning. If the price sustains below the 20-day EMA, the bears will try to pull the LUNA/USDT pair toward the strong support at $70.
Contrary to this assumption, if the price rebounds off the current level, the bulls will make another attempt to push and sustain the price above $96. If they manage to do that, the pair could rally to the all-time high at $105.
SOL/USDT
Solana (SOL) rose above the 20-day EMA ($86) on March 16 but the bulls could not push the price above the downtrend line. This indicates that the bears are active at higher levels.
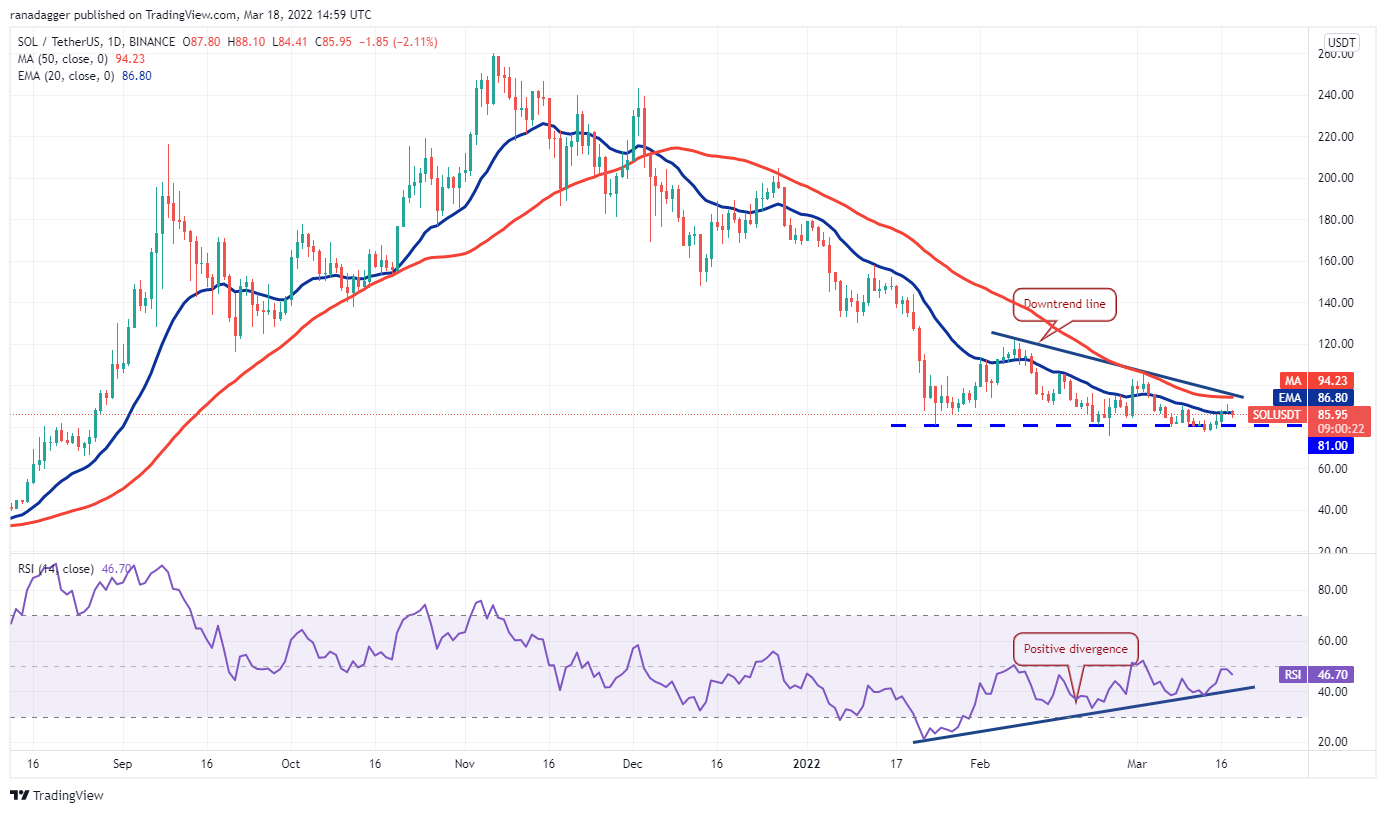 SOL/USDT daily chart. Source: TradingView
The sellers will now attempt to sink the price below the strong support zone between $81 and $75. If they succeed, it will complete a descending triangle pattern and the SOL/USDT pair could plummet to $66.
However, the flattening moving averages and the positive divergence on the RSI suggest that the bearish momentum may be weakening. If the price rebounds off the support zone, the bulls will make one more attempt to overcome the barrier at the downtrend line and push the pair to $106.
ADA/USDT
Cardano (ADA) is facing stiff resistance at the 20-day EMA ($0.84) which suggests that the bears are defending this level aggressively.
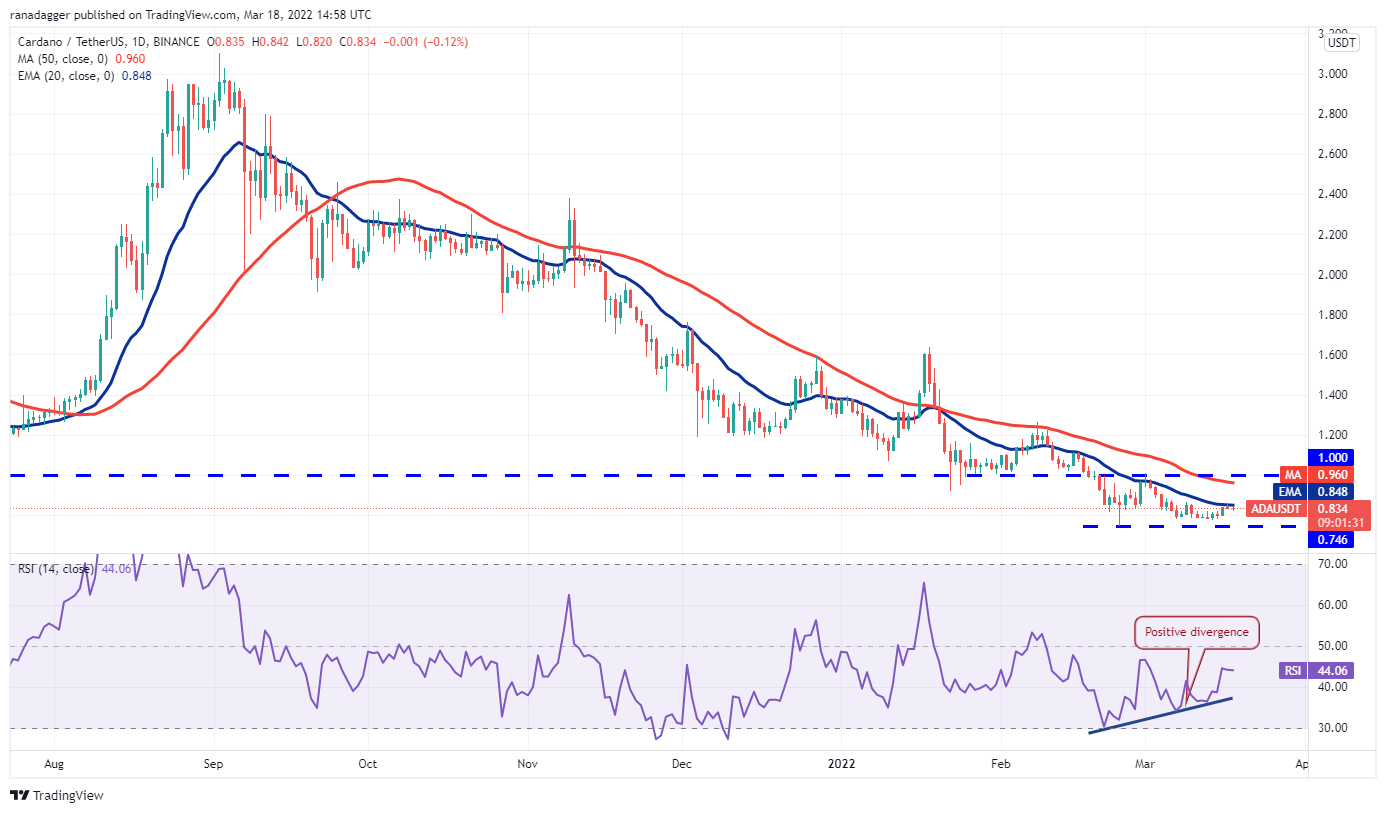 ADA/USDT daily chart. Source: TradingView
The flattening 20-day EMA and the positive divergence on the RSI suggest that the selling pressure may be waning.
If the ADA/USDT pair does not give up much ground from the current level, it will suggest that the traders are holding on to their position as they anticipate a move higher. If the price breaks and closes above the 20-day EMA, the next stop could be the overhead resistance at $1.
This positive view will invalidate if the price turns down and breaks below $0.74. The pair could then resume its downtrend and decline to $0.68.
Related: Bitcoin could see $37.5K weekend dip before ‘bigger move’ next week — new report
AVAX/USDT
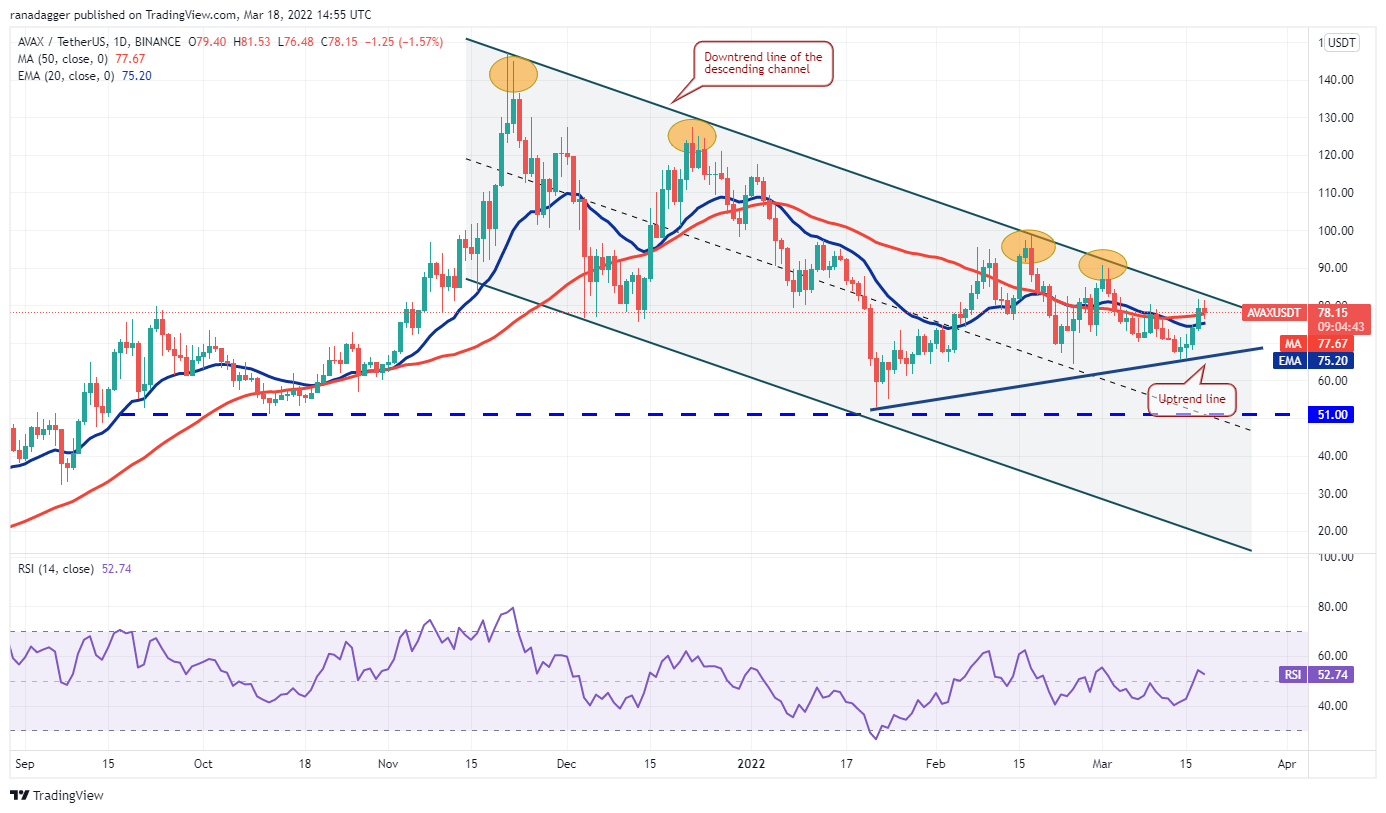
Avalanche (AVAX) broke above the moving averages on March 17 and rose to the downtrend line of the descending channel. The bears are expected to mount a strong defense at this resistance.
 AVAX/USDT daily chart. Source: TradingView
The flattish moving averages and the RSI just above the midpoint indicate a minor advantage to buyers. If bulls sustain the price above the 20-day EMA ($75), the prospects of a break and close above the channel improve.
A close above the channel will be the first sign of a possible change in trend. The bulls will then attempt to drive the price toward the psychological level at $100.
This positive view will be invalidated in the short term if the price breaks and sustains below the 20-day EMA. The AVAX/USDT pair could then drop to the uptrend line.
DOT/USDT
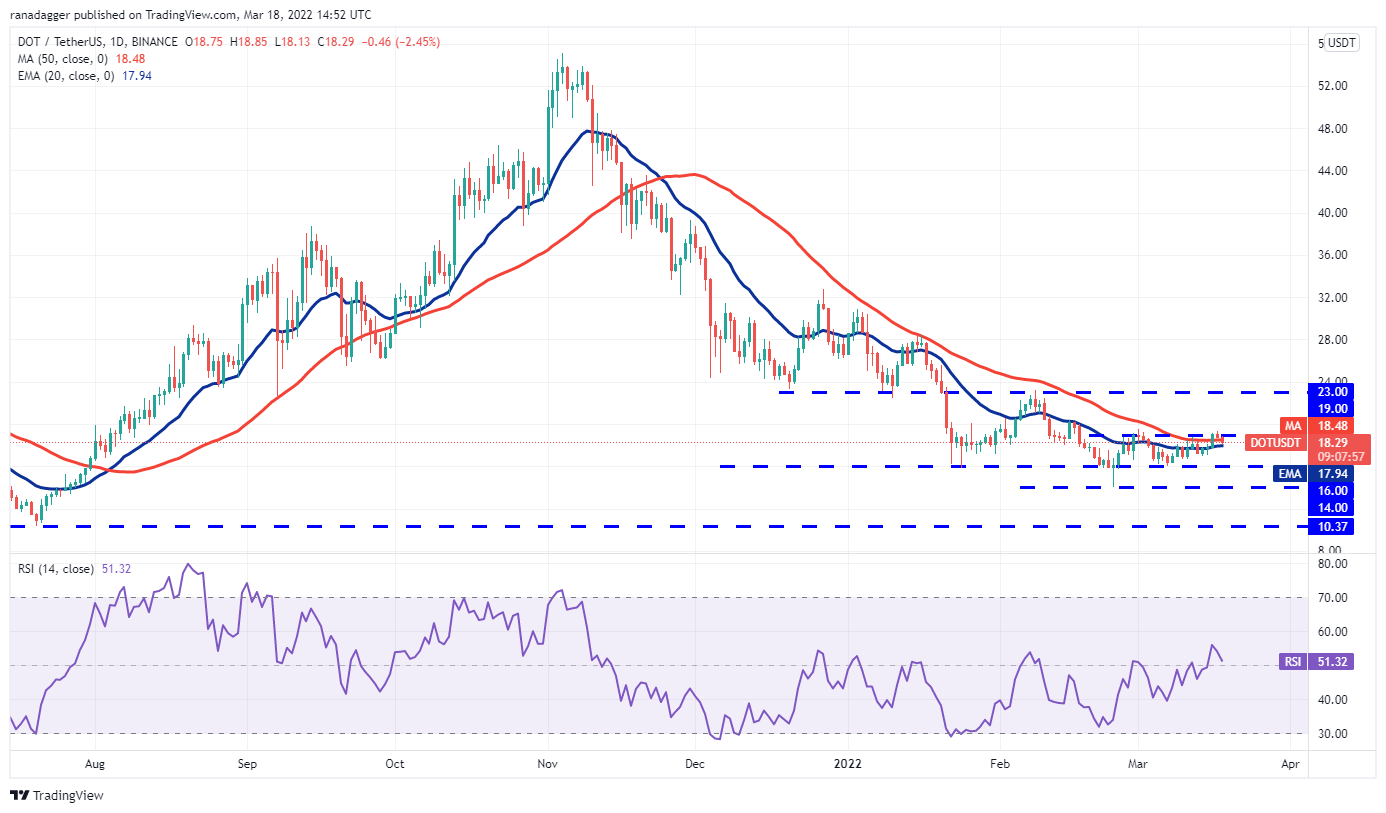
Polkadot (DOT) broke and closed above the 50-day SMA ($18) on March 16 but the bulls could not sustain the price above the overhead resistance at $19. This suggests that the bears are not willing to give up easily.
 DOT/USDT daily chart. Source: TradingView
The price has turned down from the overhead resistance but a minor positive is that the bulls are attempting to defend the moving averages. If the price rebounds off the moving averages, it will increase the possibility of a break and close above the overhead resistance. The DOT/USDT pair could then start its journey toward $23.
Conversely, if the price slips below the 20-day EMA ($17), the pair could drop toward the support at $16. The pair could then extend its stay inside the $16 to $19 range for a few more days.
DOGE/USDT
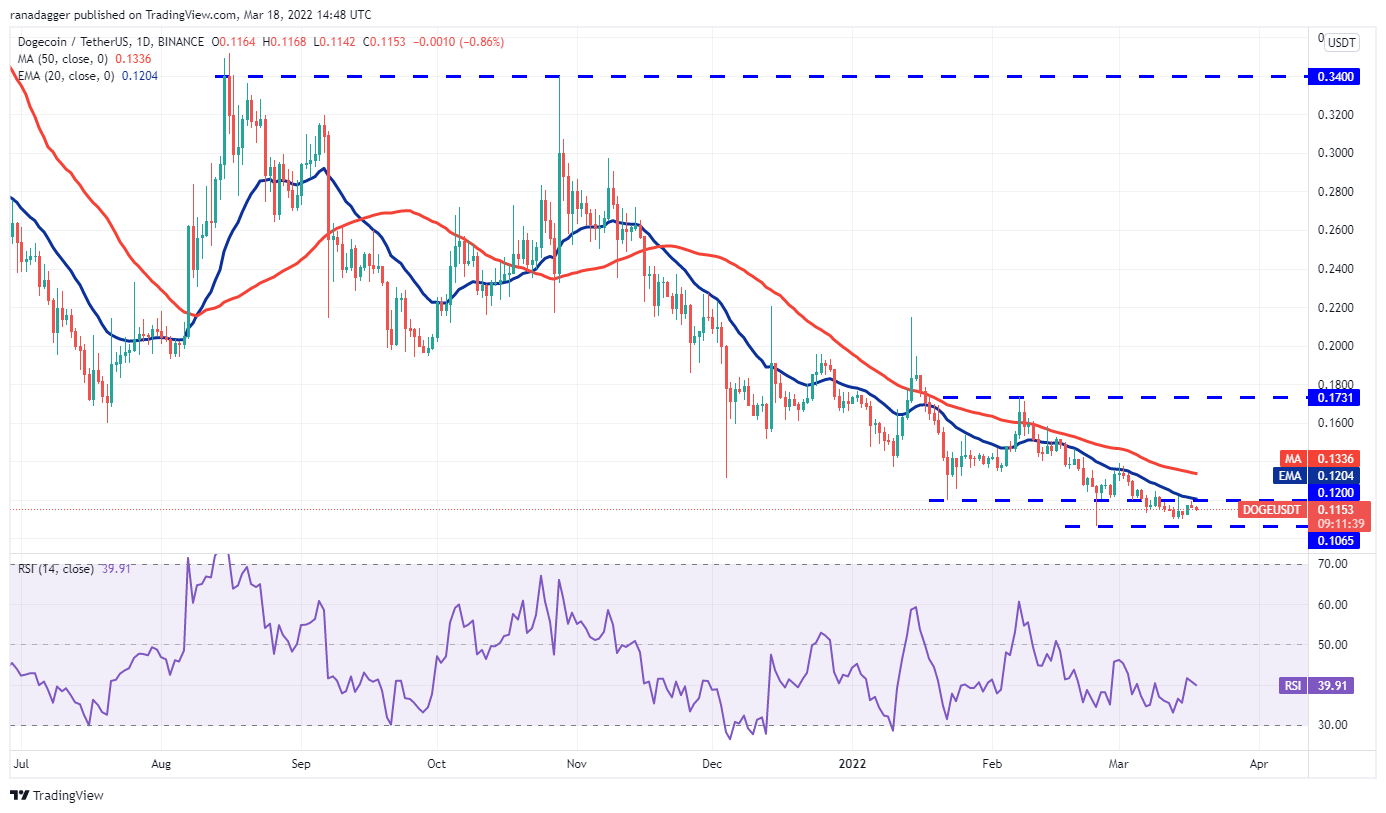
Dogecoin (DOGE) once again turned down from the 20-day EMA ($0.12) on March 17, indicating that bears continue to sell near the resistance levels.
 DOGE/USDT daily chart. Source: TradingView
The sellers will now try to pull the price down to the strong support at $0.10. If the price bounces here, the DOGE/USDT pair could remain range-bound between $0.12 and $0.10 for a few days.
The first sign of strength will be a break and close above the 20-day EMA. That could push the price to the 50-day SMA ($0.13), which may again act as a strong resistance.
A break and close above this resistance could attract buyers and open the doors for a possible rally to $0.17. Conversely, a break and close below $0.10 will suggest the resumption of the downtrend.
The views and opinions expressed here are solely those of the author and do not necessarily reflect the views of Cointelegraph. Every investment and trading move involves risk. You should conduct your own research when making a decision.
Market data is provided by HitBTC exchange.


