While Bitcoin (BTC) and major altcoins tend to garner most of the attention from investors, there are several projects that aim to bring greater decentralization, transparency, accountability and financial inclusion to society and businesses.
For the past few months, Cointelegraph has been identifying such projects extensively and several of the tokens recently highlighted have seen a massive surge in their performance.
A good investor should keep track of how all the assets in their portfolio perform and during occasional reviews the underperformers should be removed and additional capital deployed toward the assets that continue to produce profits.
In this new series, we will look back at some of the projects which were analyzed earlier this year in order to provide an update on their fundamentals and their current technical set up.
LUNA/USD
Terra protocol’s LUNA token was trading for $0.6310 when it was featured on Dec. 29, 2020. Since then, LUNA price has skyrocketed to $12.12 which is a gain of 1,821% in about two and half months.
VORTECS™ data from Cointelegraph Markets Pro diverged from the price on March 7, hinting at a possible bullish outlook even as the price continued to weaken.
The VORTECS™ score, exclusive to Cointelegraph, is an algorithmic comparison of historic and current market conditions derived from a combination of data points including market sentiment, trading volume, recent price movements and Twitter activity.
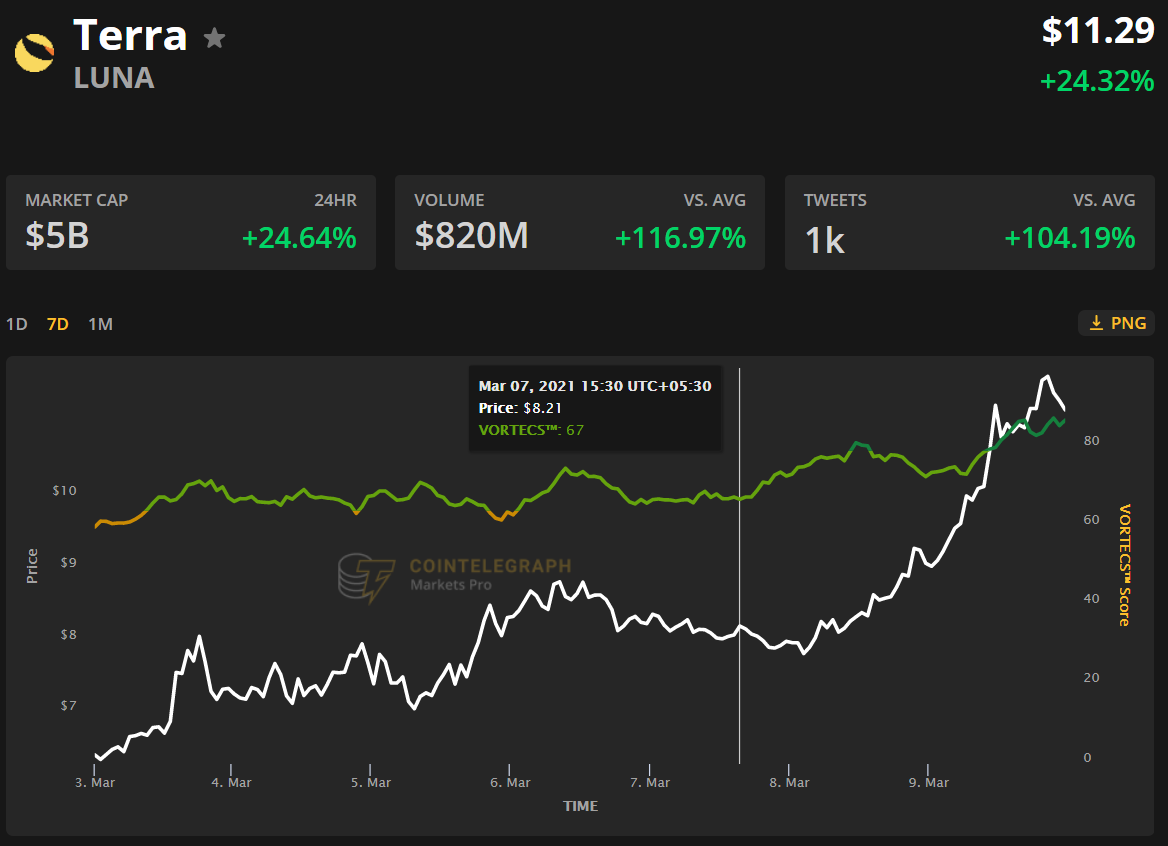 VORTECS™ Score (green) vs. LUNA price. Source: Cointelegraph Markets Pro
The chart above shows that the price continued to fall on March 7, but the VORTECS™ score remained firm at 67 and then started to turn up a few hours before LUNA bottomed out near $7.83 on March 8.
By then, the VORTECS™ score had reached 75 and it continued to pick up momentum as the price reached $11.69 on March 9 when the VORTECS™ score hit 86.
On the fundamental development front, TerraUSD and it’s UST stablecoin witnessed huge demand from Mirror, which is Terra’s synthetic assets protocol. To fulfill the demand, 80 million Luna were burnt to mint 447 million UST. This reduced LUNA’s circulating supply from 484 million to 404 million, which has been a bullish development for its price.
Another event that proved to be positive was Robinhood’s trading ban on the GameStop, BlackBerry and AMC stock. This may have directed a large number of traders to decentralized exchanges and synthetic assets.
During this time, Mirror protocol’s daily trading volumes hit an all-time high at $44.42 million. The total value of locked assets on Mirror also reached 800 million in UST.
To boost further use of UST, Terra funded its strategic investment arm Terraform Capital with $10 million in seed capital. These funds will be used to fund projects that use UST and LUNA.
In addition to the developments on the fundamental front, Terraform Labs, the company that manages Terra, received a boost when it raised $25 million from Mike Novogratz’s Galaxy Digital. This may have brought the firm in the focus of other larger investors.
LUNA broke out of the $5 to $8.50 range on March 8 and picked up momentum, reaching the target objective at $12 today. Traders seem to have booked profits near $12 as seen from the long wick on the day’s candlestick.
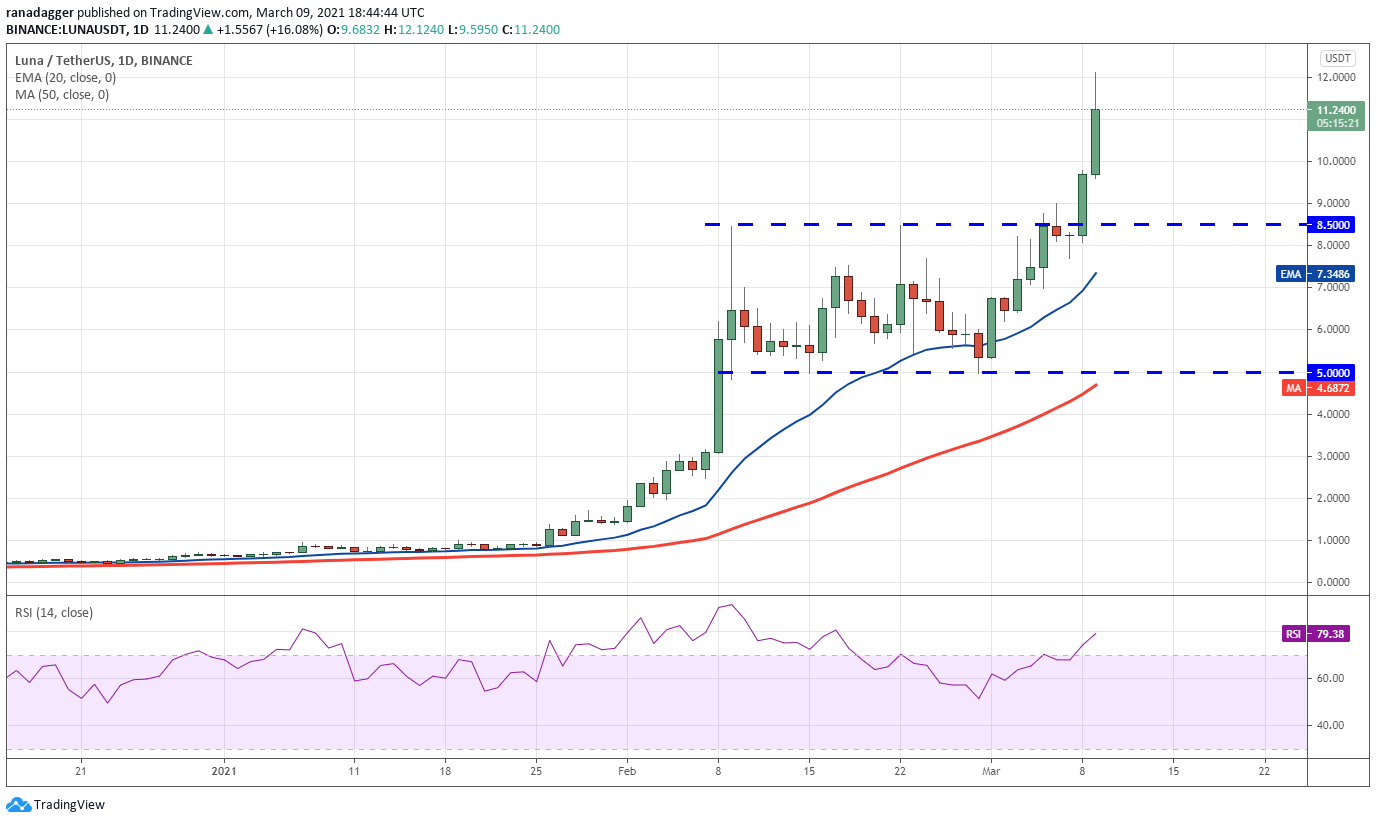 LUNA/USDT daily chart. Source: TradingView
The rally has pushed the relative strength index (RSI) above 79, which suggests the LUNA/USD pair is overbought in the short term. This could result in a consolidation or a minor correction in the next few days.
During the next dip, if the bulls can flip the $8.50 level into support, it could act as a launchpad for the next leg of the uptrend that may reach $15.50.
On the contrary, if the bears sink the price below $8.50, the pair may drop to the 20-day exponential moving average at $7.34. This is an important support to watch out for because a rebound off it could keep the uptrend intact.
However, if the bears sink the price below the 20-day EMA, the pair may drop to the 50-day simple moving average at $4.68.
VET/USD
VeChain Token (VET) has also been on a tear since it was highlighted on Dec. 29, 2020. The token has surged from $0.01916002 to $0.0675 today, a gain of 252% in a short time.
Let’s look at the new fundamental developments that may have provided the boost.
Norway’s Hydro has partnered with DNV blockchain and started the pilot service of “Tag. Trace. Trust.” which aims to provide sustainability claims with verified data. This new platform allows customers to trace the entire journey of the product right from the factory gates until it reaches them.
Hydro plans to keep track of the CO2 emission and the aluminum traceability from the raw material stage, to the finished product. If the pilot succeeds, it could bring many other industries to try this service.
Another project by Danish company ReSea, which cleans rivers and oceans has been certified by DNV’s Chain of Custody. With the certification, any third party can check and trace the recovered plastic, ensuring transparency in the community-driven collection process. The data is collected, recorded and monitored on the ToolChain platform and associated mobile app.
Along with real-world use cases, VeChain’s technology has also been used to launch VIMworld, an NFT-based collectibles platform that may benefit from the current NFT mania. This shows that VeChain is being used across several industries.
Currently, VET is in a strong uptrend. The bulls pushed the price above the $0.060 overhead resistance on March 8, signaling the resumption of the up-move.
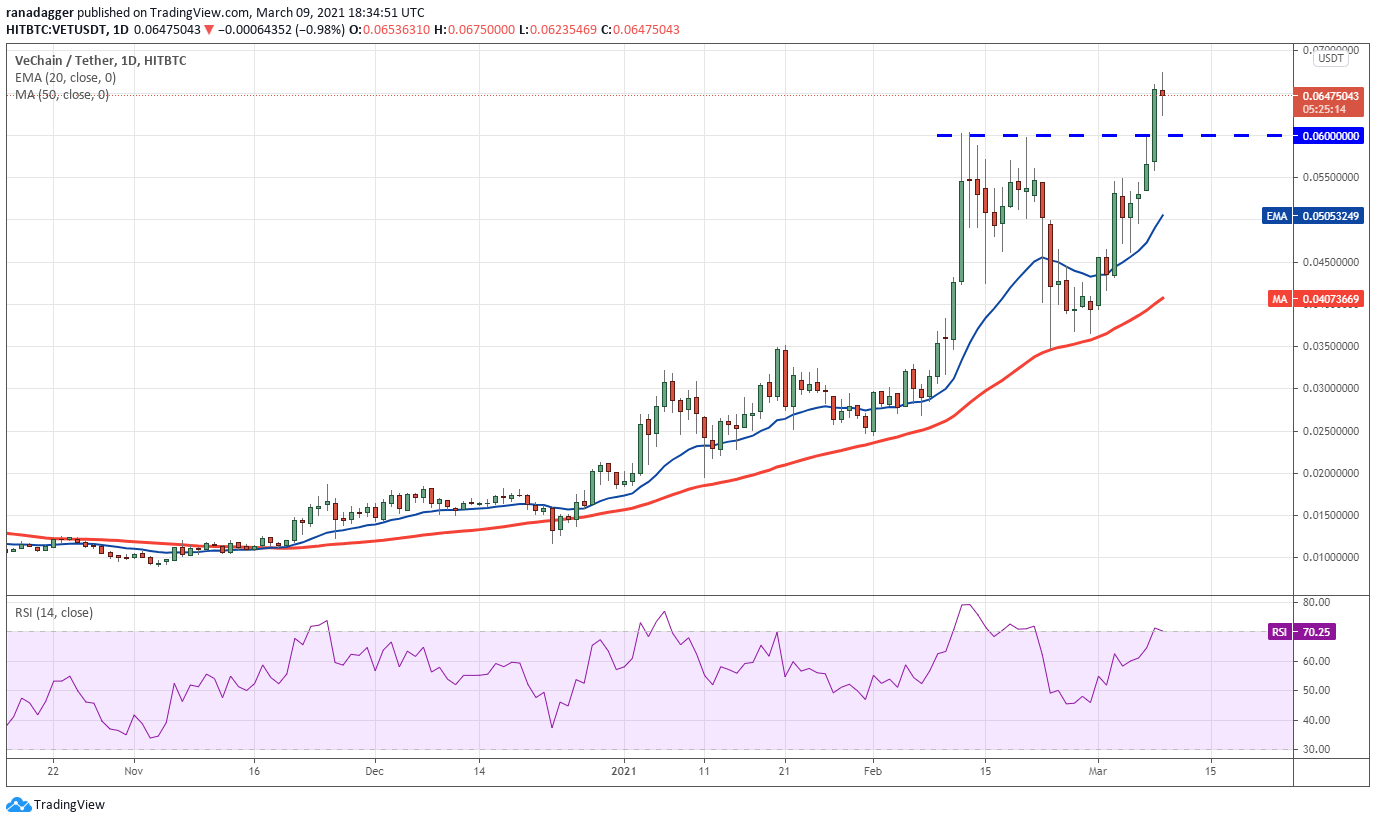 VET/USDT daily chart. Source: TradingView
If the bulls can sustain the price above the breakout level of $0.06, the rally could reach $0.085 and then $0.10. The rising moving averages and the RSI in the overbought zone suggest the bulls are in control.
Contrary to this assumption, if the bears sink the price below $0.060, the VET/USD pair could drop to the 20-day EMA ($0.050). This is an important support because a strong rebound off it will suggest that the bulls are still buying on each dip.
On the other hand, if the bears sink the price below the 20-day EMA, the pair could drop to the 50-day SMA ($0.0407). A break below this support could signal a change in trend.
HBAR/USD
Hedera Hashgraph (HBAR) was covered on Jan. 21 when it was trading at $0.10064. The token has rallied to $0.21420 today, a gain of 112% in just a month and a half.
As gas fees soared on the Ethereum network, SUKU, the blockchain-powered supply-chain service ecosystem migrated from Ethereum to Hedera Hashgraph. This placed Hedera as a possible alternative to the Ethereum network.
In the past few days, several large companies have joined the Hedera Governing Council and will run the Hedera network nodes. Some notable names are of the Australian payments company, eftpos, which operates Australia’s national debit card processing infrastructure and mobile payments app Beem It.
Standard Bank Group, the largest African bank by assets and Électricité de France S.A. (EDF), a top five global utility firm serving customers worldwide, have also decided to join up with Hedera Hashgraph.
Hedera launched its Hedera Token Service in early February with over 60 initial ecosystem partners to support token issuers and application developers. With this move, the protocol opened its doors to the lucrative world of fungible and non-fungible tokens.
HBAR is in a strong uptrend. Both moving averages are sloping up and the RSI is in the overbought zone, indicating a clear advantage to the bulls.
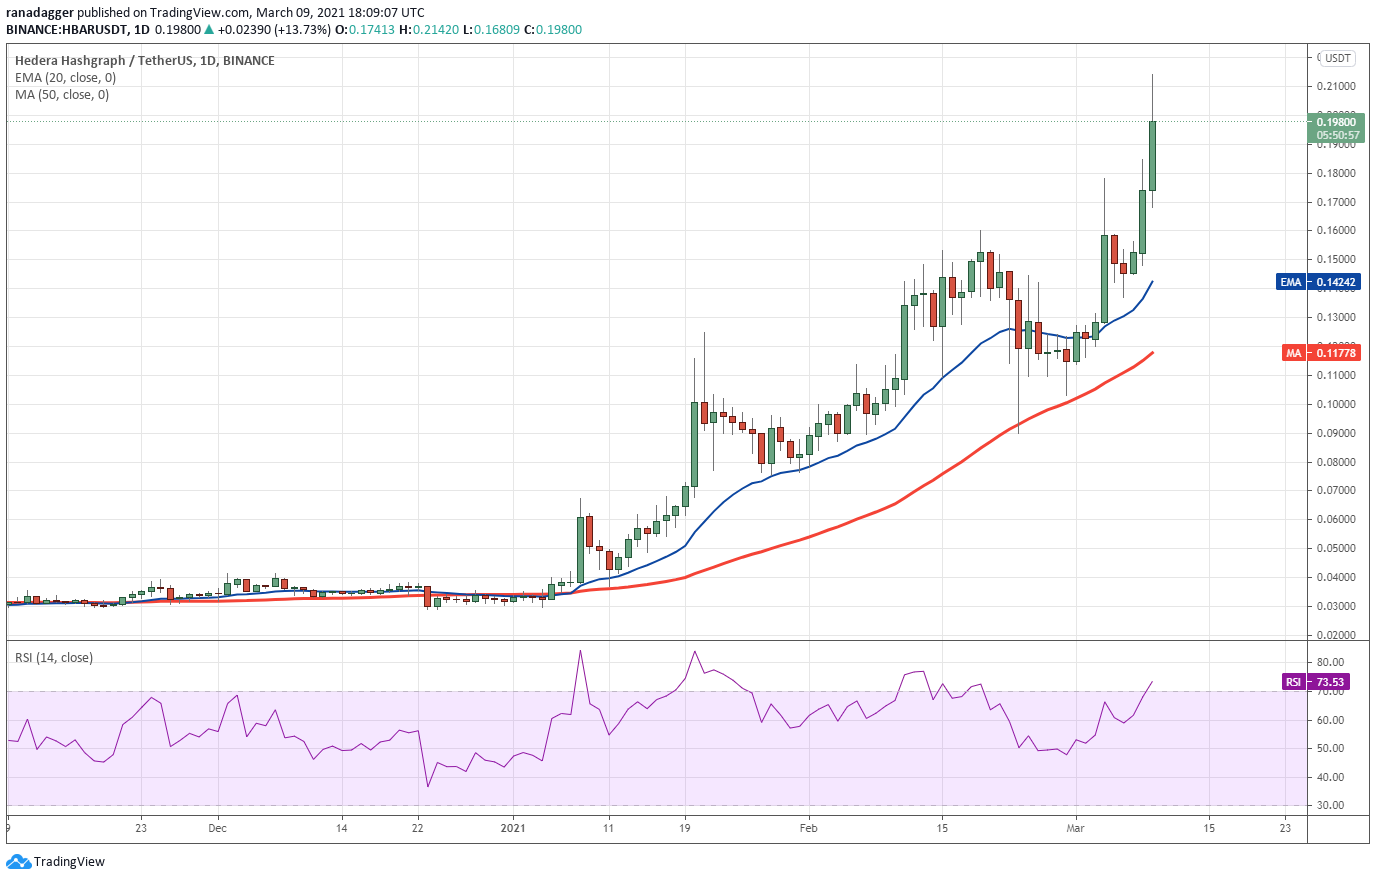 HBAR/USDT daily chart. Source: TradingView
However, the long wick on today’s candlestick suggests traders are booking profits at higher levels. The first support on the downside is $0.16 and if that breaks, the HBAR/USD pair could drop to the 20-day EMA ($0.142).
A strong rebound off either level will indicate buying on dips. The bulls will then try to resume the uptrend and push the price to the next major resistance at $0.25.
Contrary to this assumption, if the price turns down and breaks below the 50-day SMA at $0.117, the pair will signal a possible change in trend. The bears will then try to sink the pair to $0.08.
The views and opinions expressed here are solely those of the author and do not necessarily reflect the views of Cointelegraph. Every investment and trading move involves risk, you should conduct your own research when making a decision.