There is an old proverb which says that history does not always repeat, but it tends to rhyme. If that holds true for Bitcoin (BTC), then a strong up-move may not happen in the month of September.
Bybit data shows that since 2013, Bitcoin has closed September in the red for six years and has managed a positive monthly close only on two occasions. The best performance was in 2016 when Bitcoin rose 6.04%.
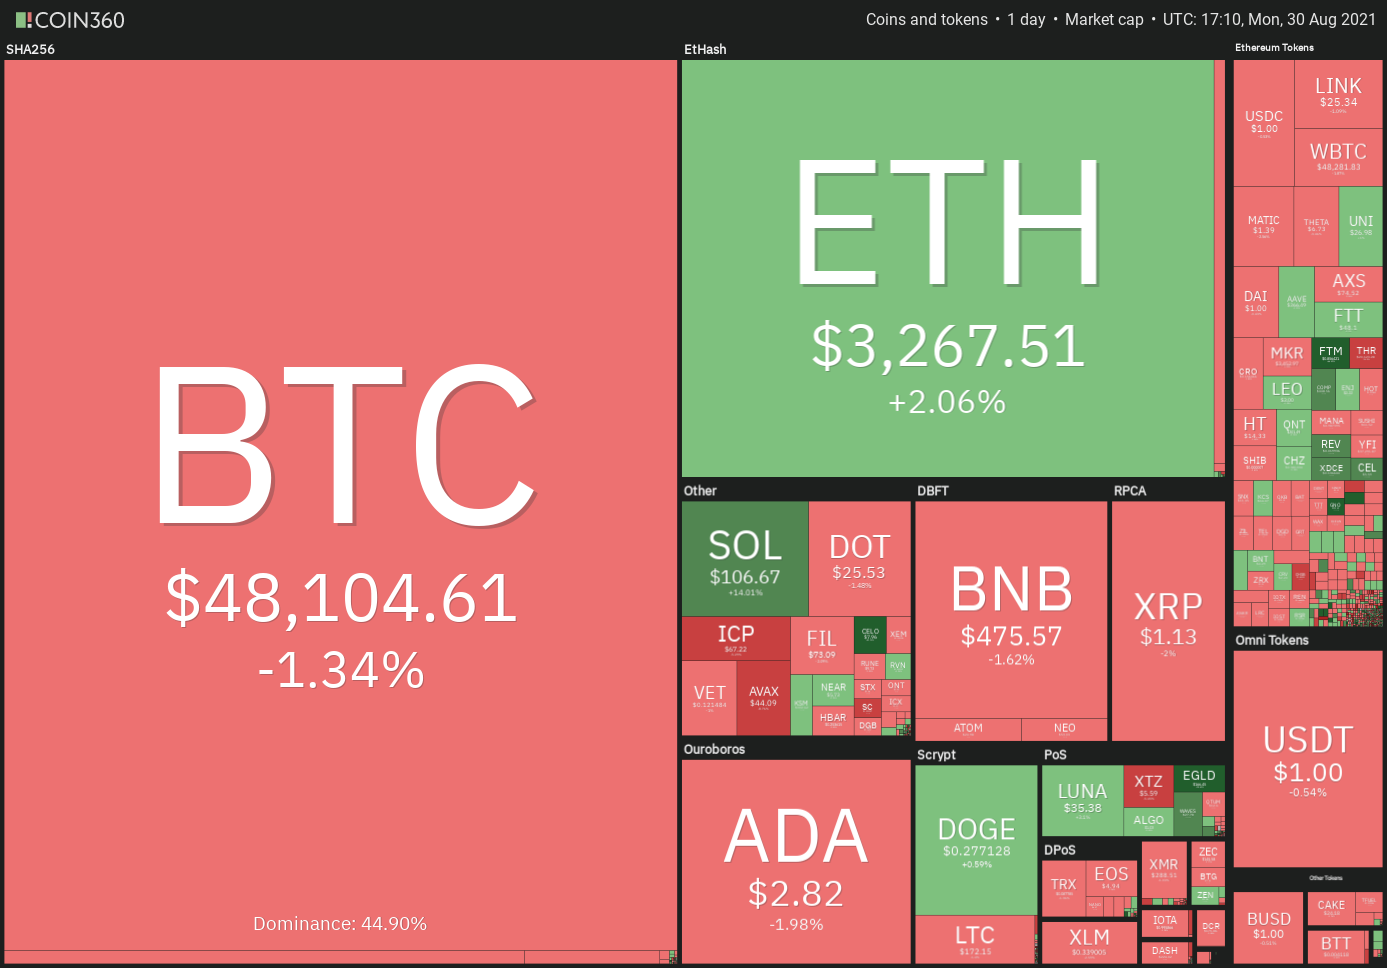 Daily cryptocurrency market performance. Source: Coin360
However, September’s poor historical performance has not stopped small and large traders from accumulating Bitcoin in August. Ecoinometrics reported rising account balances for addresses holding 1,000 to 10,000 BTC and for accounts that hold less than one Bitcoin.
Will September’s poor historical record scare away the bulls or will this year be an exception? Let’s analyze the charts of the top-10 cryptocurrencies to find out.
BTC/USDT
The bulls again failed to push the price above the overhead resistance at $50,000 on Aug. 29, suggesting that bears are defending the level aggressively. Bitcoin formed a Doji candlestick pattern on Aug. 29, which has resolved to the downside today.
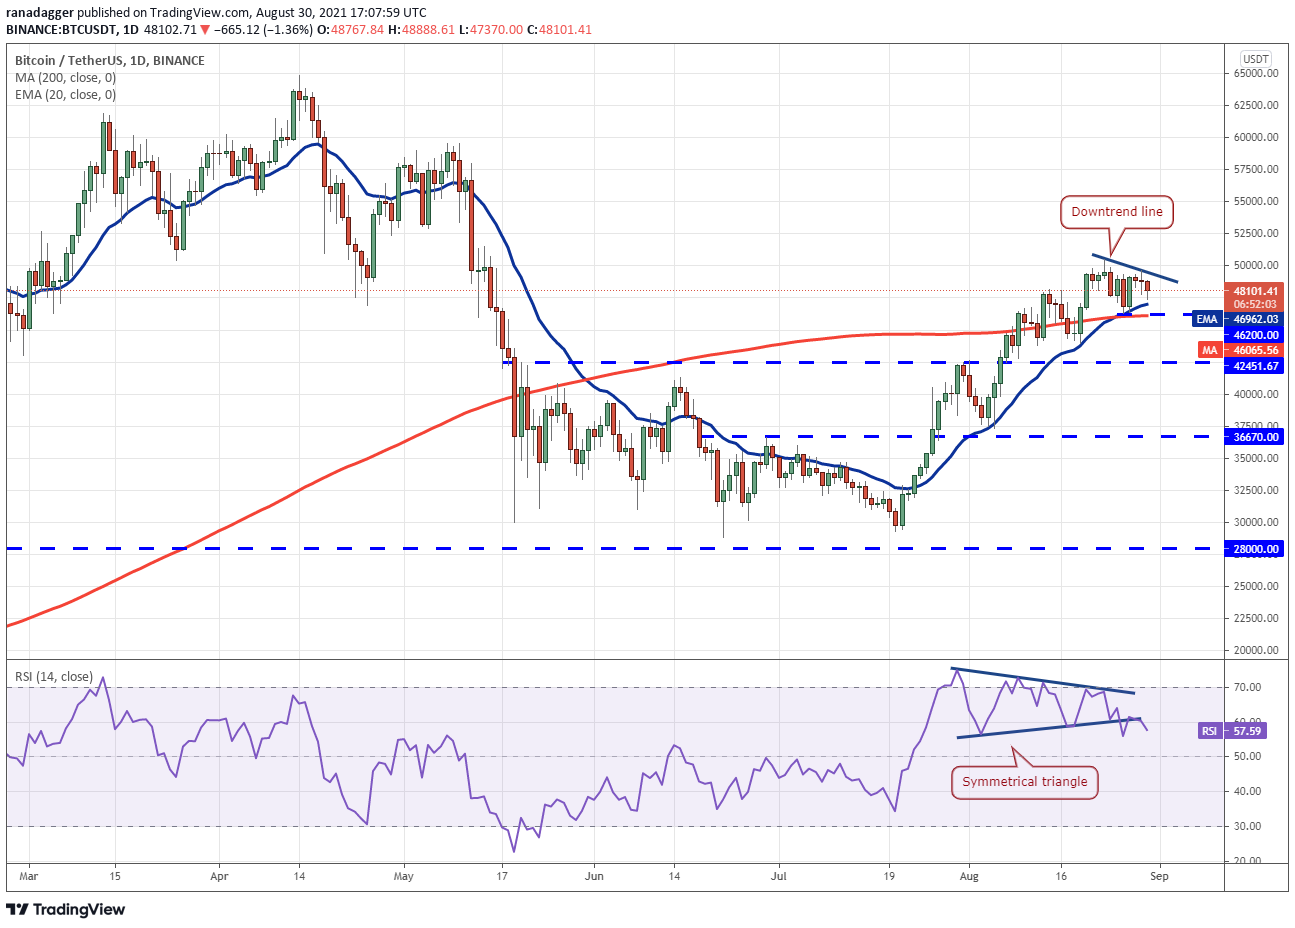 BTC/USDT daily chart. Source: TradingView
The failure of the relative strength index (RSI) to climb back into the symmetrical triangle indicates weakness. If bears pull the price below the 200-day simple moving average ($46,065), the BTC/USDT pair could drop to the next support at $42,451.67.
This level is likely to act as a strong support. If the price rebounds off this level, the pair may remain range-bound between $42,451.67 and $50,500 for a few days.
A break and close below $42,451.67 will signal the start of a deeper correction. The pair may then correct to $36,670.
This negative view will invalidate if the price turns up from the current level and breaks above $50,500. Such a move could open the gates for a rally to $60,000.
ETH/USDT
Ether (ETH) once again turned down from the overhead resistance zone at $3,335 to $3,377.89 on Aug. 29. This suggests that bears are defending the overhead zone aggressively.
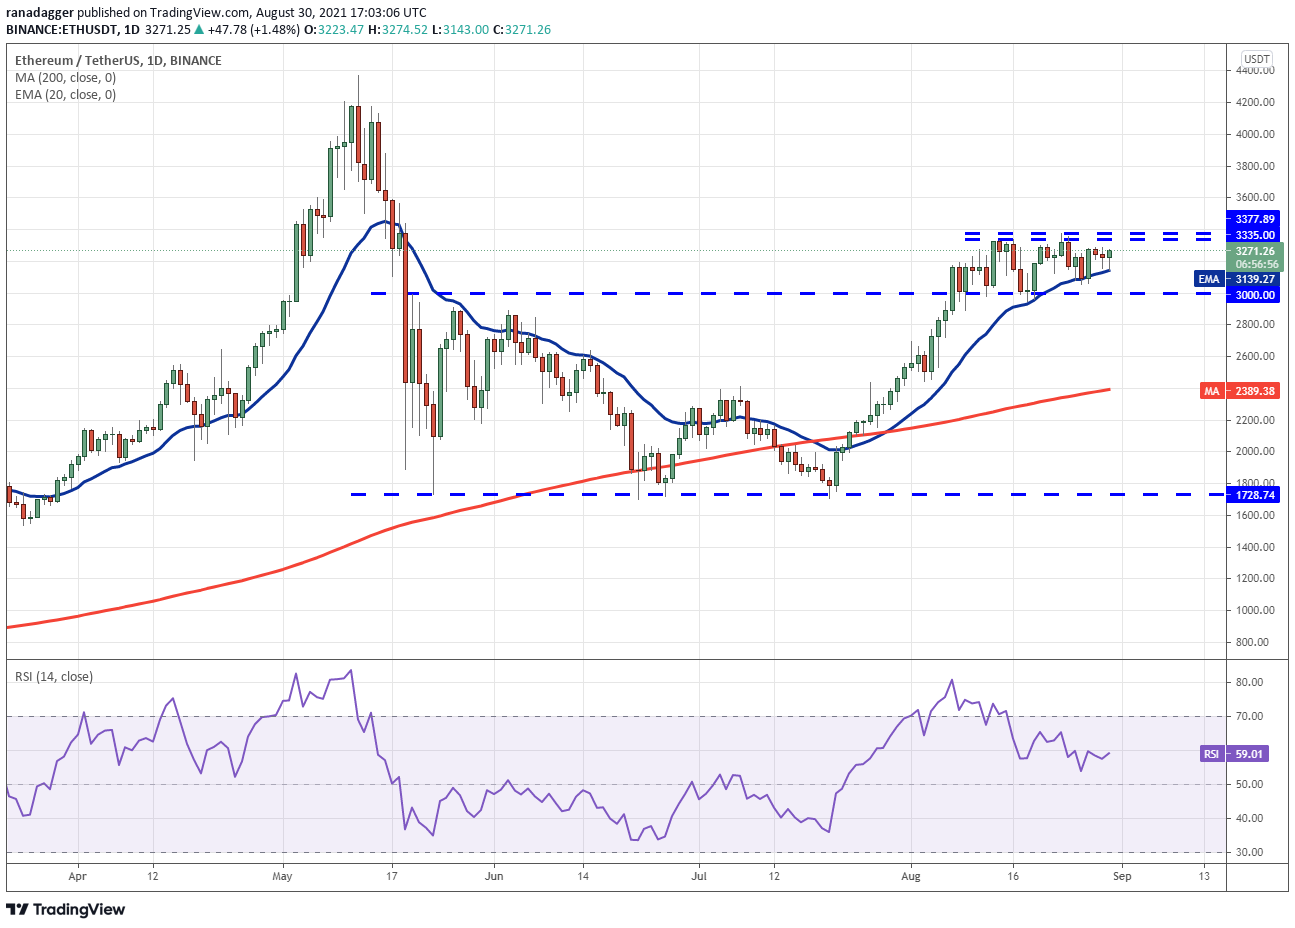 ETH/USDT daily chart. Source: TradingView
However, the bulls haven’t surrendered and are defending the 20-day exponential moving average ($3,139) as seen from the strong rebound today. If bulls drive the price above the overhead zone, the ETH/USDT pair may resume its up-move with a target objective at $3,670 and then $4,000.
On the other hand, if bears pull the price below the 20-day EMA, the ETH/USDT pair could drop to the breakout level at $3,000. A bounce off this level may keep the pair range-bound between $3,000 and $3,377.89 for a few more days.
A deeper correction may start if bears pull and sustain the price below the breakout level at $3,000. That could result in a decline to the 200-day SMA ($2,389).
ADA/USDT
Cardano (ADA) turned down from $2.95 on Aug. 28, suggesting that bears are aggressively defending the overhead resistance at $2.97. That was followed by a Doji candlestick pattern on Aug. 29, indicating indecision among the bulls and the bears.
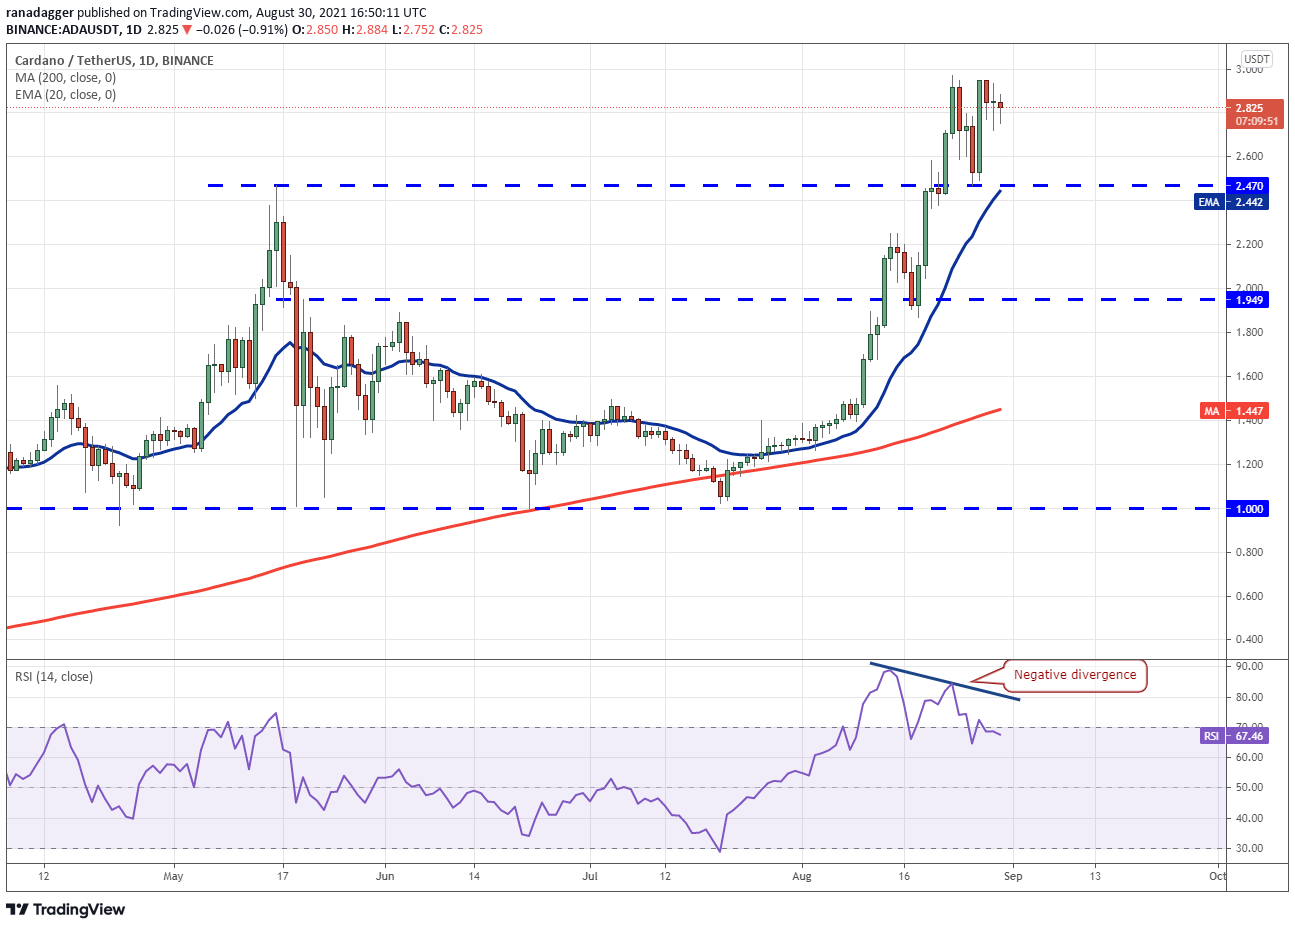 ADA/USDT daily chart. Source: TradingView
The uncertainty has extended today with the formation of the inside-day candlestick pattern. If sellers sink the ADA/USDT pair below the Aug. 29 intraday low at $2.71, the pair may again drop to the breakout level at $2.47. A strong rebound off this level may keep the pair range-bound between $2.47 and $2.97 for a few days.
Although the upsloping 20-day EMA ($2.44) suggests advantage to buyers, the negative divergence on the RSI indicates the momentum is weakening. A break and close below $2.47 will suggest the start of a deeper correction. The pair may then drop to $2.20.
The bulls will have to push and sustain the price above the psychological level at $3 to signal the resumption of the uptrend.
BNB/USDT
The failure of the bulls to push and sustain Binance Coin (BNB) above the May 19 intraday high at $516.50 may have attracted profit-booking from short-term traders. The altcoin has turned down and it may now drop to the breakout level at $433.
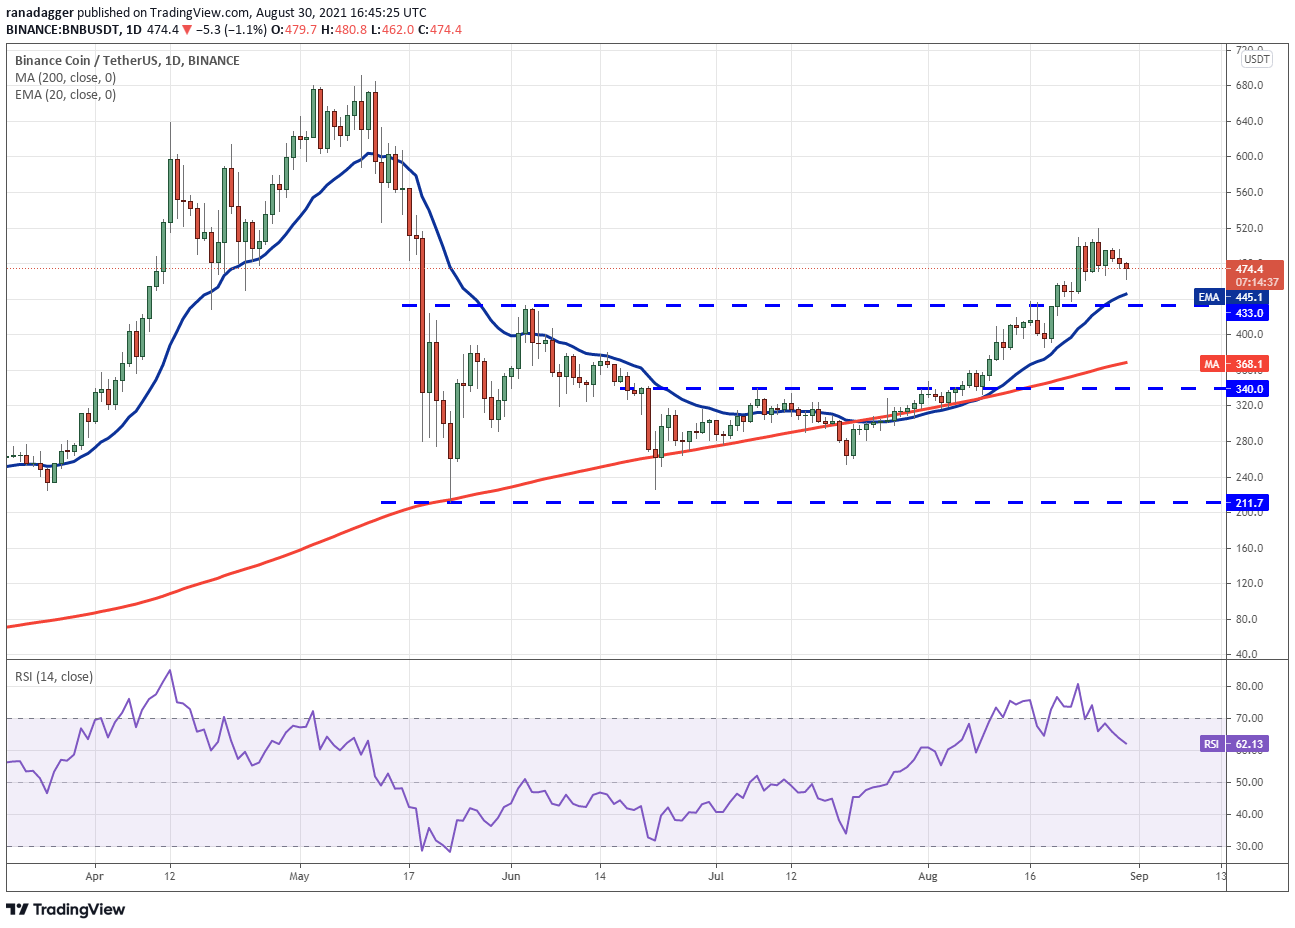 BNB/USDT daily chart. Source: TradingView
The bulls are likely to aggressively defend the support zone between the 20-day EMA ($445) and the breakout level at $433. A strong rebound off this zone will suggest that the sentiment remains positive and bulls are buying on dips.
A breakout and close above $520 will signal the resumption of the uptrend. The BNB/USDT pair may then rally to $600. Conversely, if bears sink the price below $433, the pair could drop to the 200-day SMA ($368).
XRP/USDT
XRP rebounded off the $1.07 support on Aug. 27 but the bulls could not push the price to the downtrend line. This suggests that demand dries up at higher levels. The bears are currently attempting to sink the price to the critical support at $1.07.
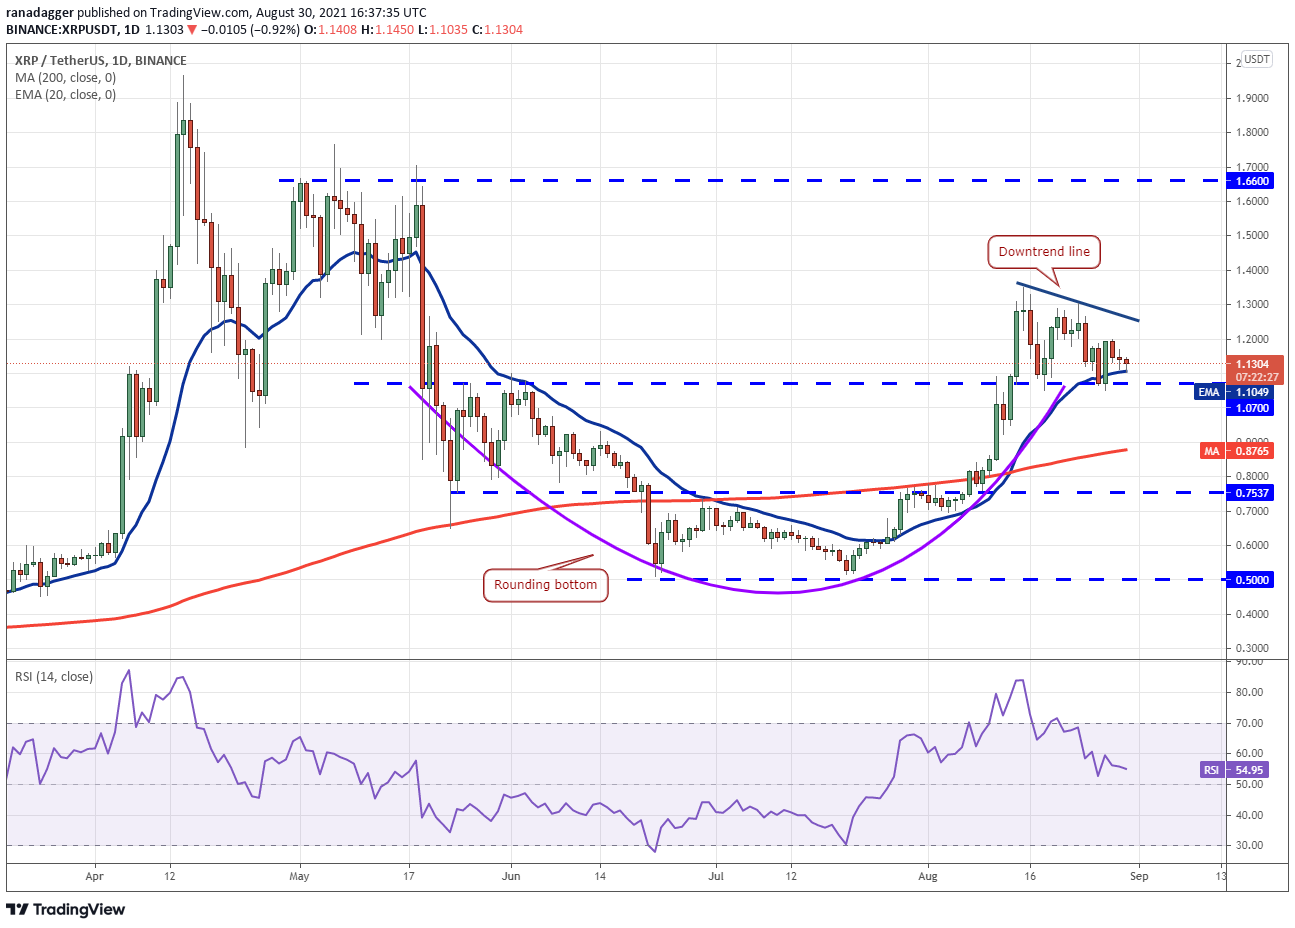 XRP/USDT daily chart. Source: TradingView
The price action of the past few days has formed a descending triangle pattern, which will complete on a break and close below $1.05. This setup has a target objective at $0.75. The flattening 20-day EMA ($1.10) and the RSI near the midpoint suggest that bulls are losing their grip.
Conversely, if the price rebounds off the $1.05 support and breaks above the downtrend line, it will negate the bearish setup. The failure of a bearish pattern is a bullish sign. The pair may then start its rally to $1.35 followed by a move to $1.66.
DOGE/USDT
Dogecoin (DOGE) rose above the overhead resistance at $0.29 on Aug. 27 but the bulls could not sustain the higher levels. The price dipped back below $0.29 on Aug. 28.
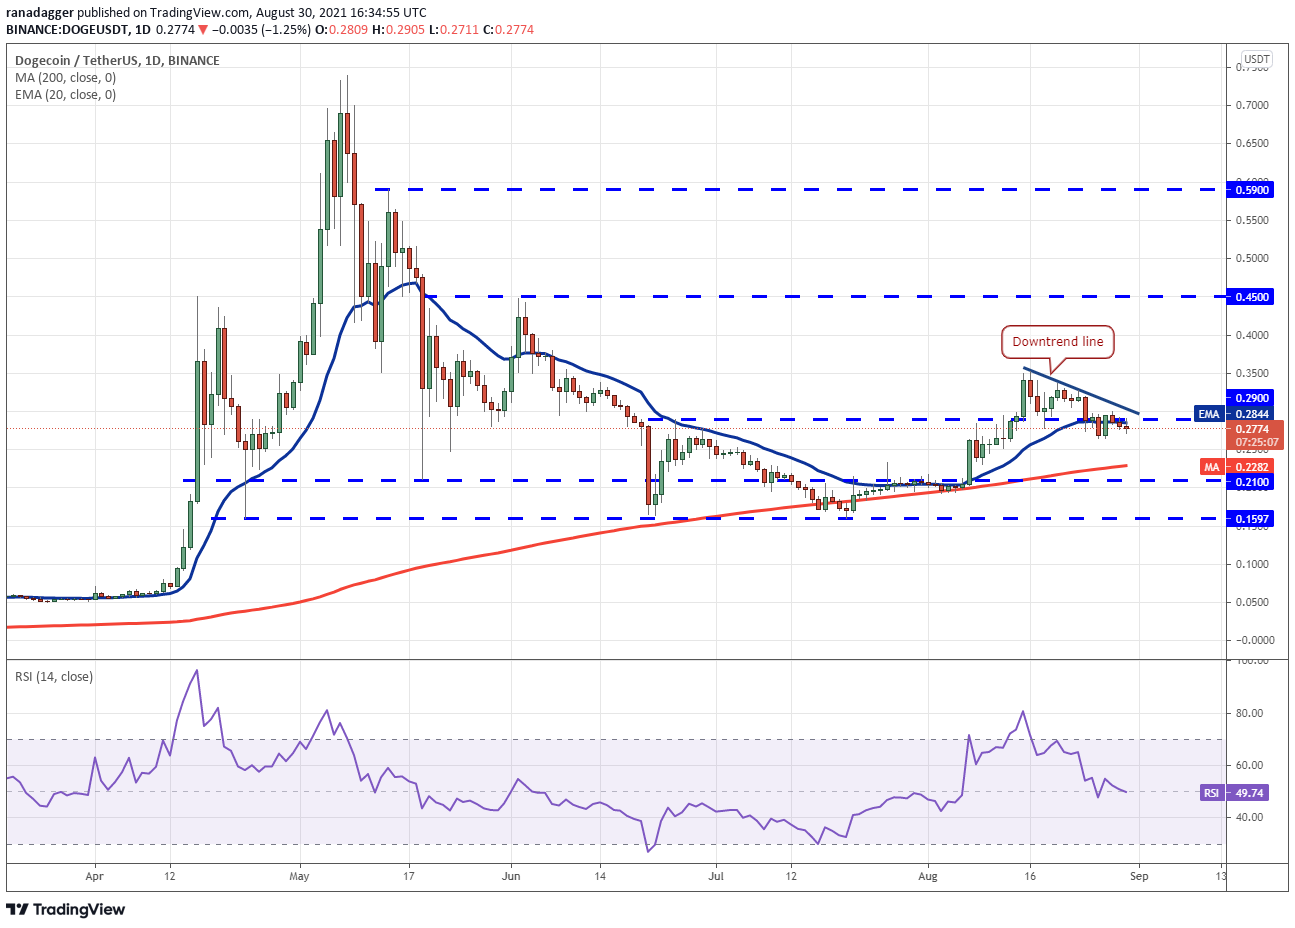 DOGE/USDT daily chart. Source: TradingView
The bears will now try to sink the price below the immediate support at $0.26. If they can pull it off, the DOGE/USDT pair could drop to the critical support at $0.21.
The flat 20-day EMA ($0.28) and the RSI near the midpoint suggest a balance between supply and demand.
This balance will shift in favor of the bulls if they can push and sustain the price above the downtrend line. The pair may then rally to $0.35 and later to $0.45.
SOL/USDT
Solana (SOL) is in a strong uptrend. The up-move halted on Aug. 29 but the long tail on the day’s candlestick showed that bulls bought on dips. The buyers have again pushed the price to a new all-time high today.
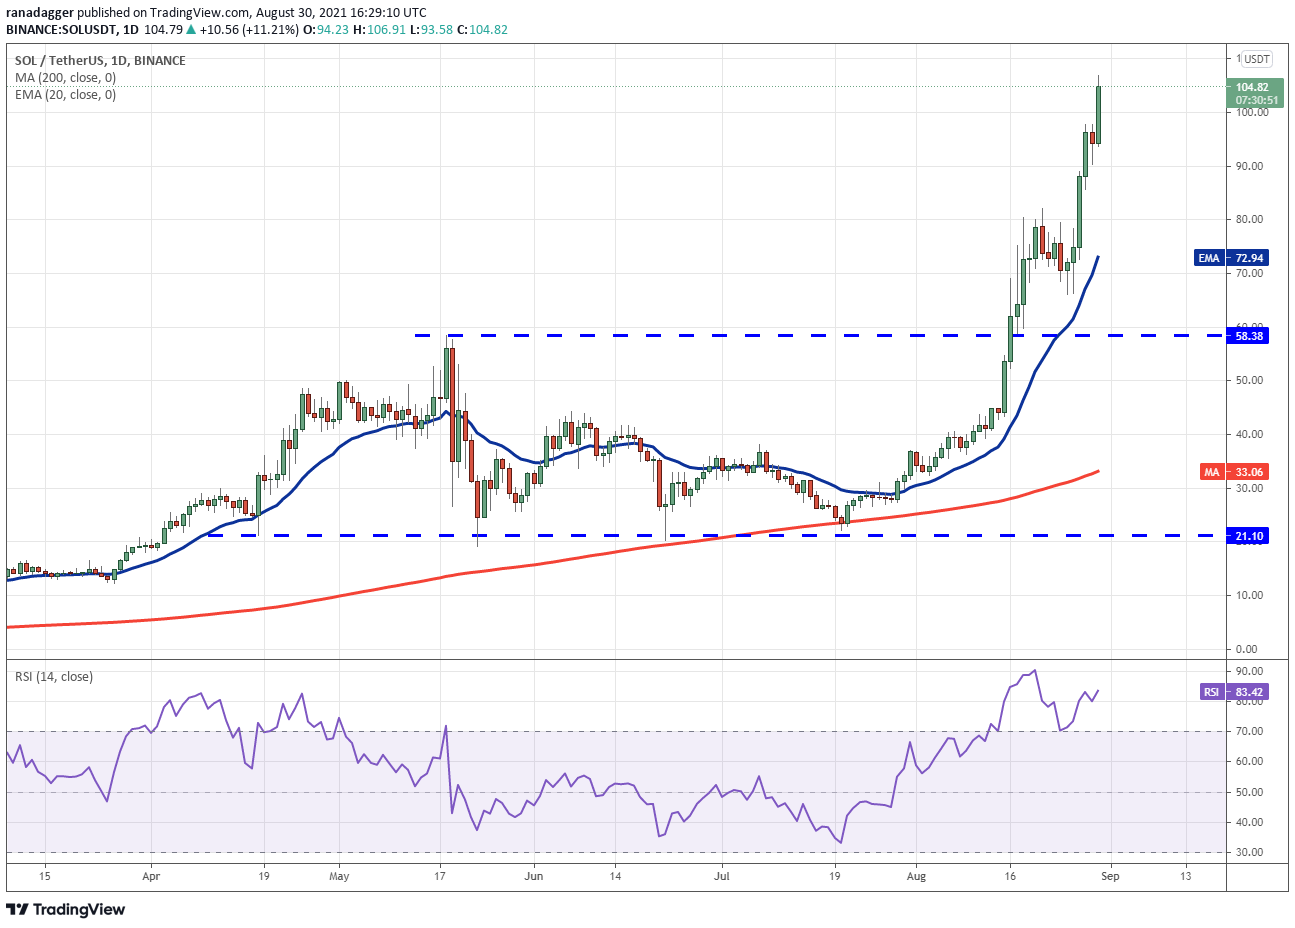 SOL/USDT daily chart. Source: TradingView
If bulls sustain the price above $100, the SOL/USDT pair could start its journey toward the next target at $122.09. Although the momentum is strong, the RSI above 83 suggests the rally is overheated in the short term.
The first sign of weakness will be a break and close below $90. That will suggest that traders are aggressively booking profits. The pair could then correct to the 20-day EMA ($72), which is likely to act as a strong support. A break and close below this support will signal a possible change in trend.
DOT/USDT
The uptrend line in Polkadot (DOT) is acting as a resistance. Attempts by the bulls to push the price back above this line failed on Aug. 27 and 28, which suggests that traders are closing their positions on rallies.
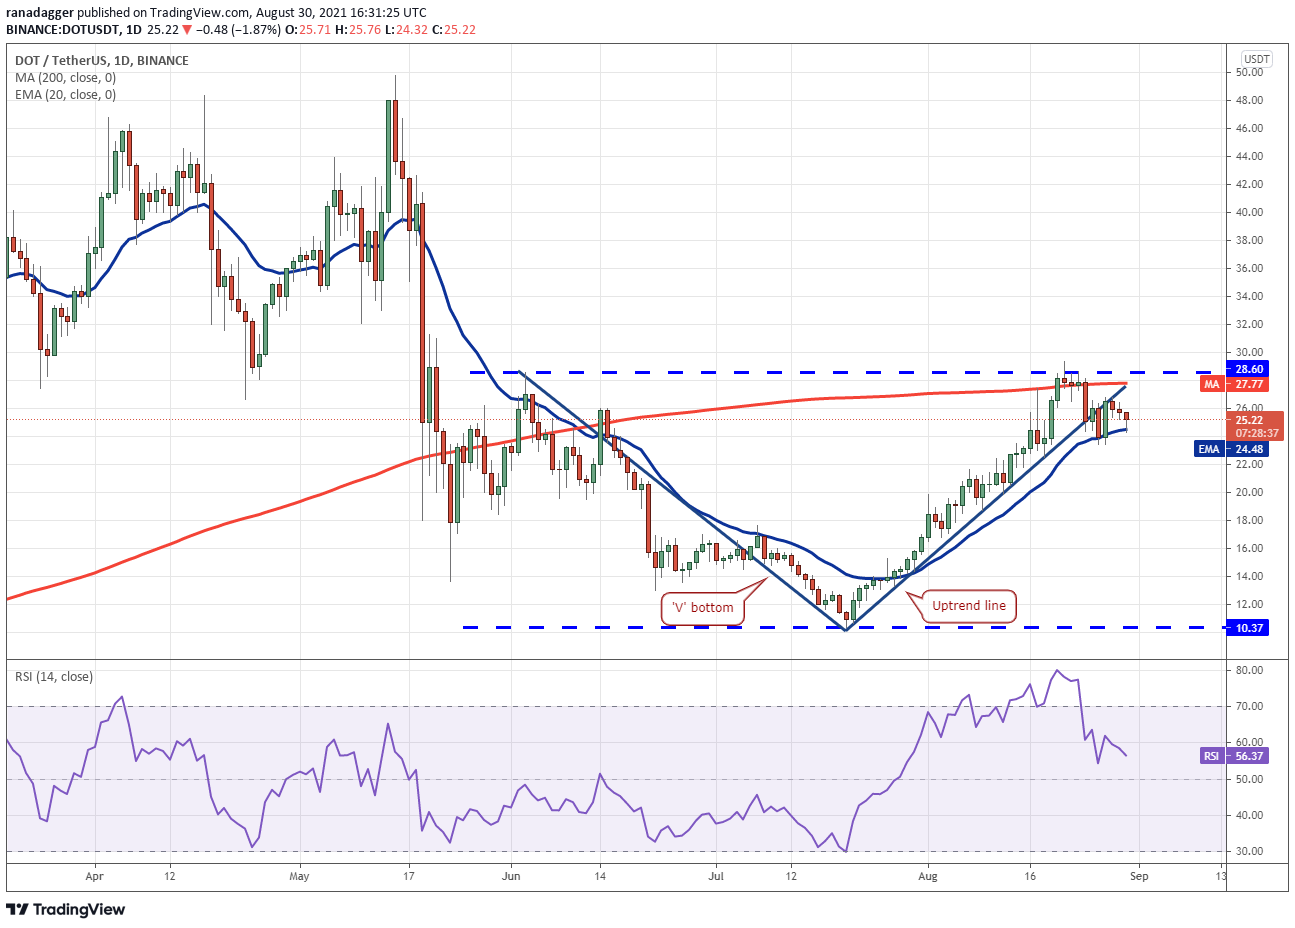 DOT/USDT daily chart. Source: TradingView
If bears pull the price below the 20-day EMA ($24.48), the DOT/USDT pair could witness further selling. The pair may then drop to the strong support at $18. Such a move will suggest that the pair may extend its range-bound action for a few more days.
The gradually flattening 20-day EMA and the RSI just above the midpoint suggest that bulls are losing their grip. To gain the upper hand, the bulls will have to push and sustain the price above $28.60. That will complete a V-bottom pattern, which has a target objective at $46.83.
Related: This service is declaring that it’s “crypto altseason” again
UNI/USDT
Uniswap (UNI) bounced off the $25 support on Aug. 27 and rose above the moving averages but the bulls could not sustain the higher levels. This suggests that bears have not given up and are selling on rallies.
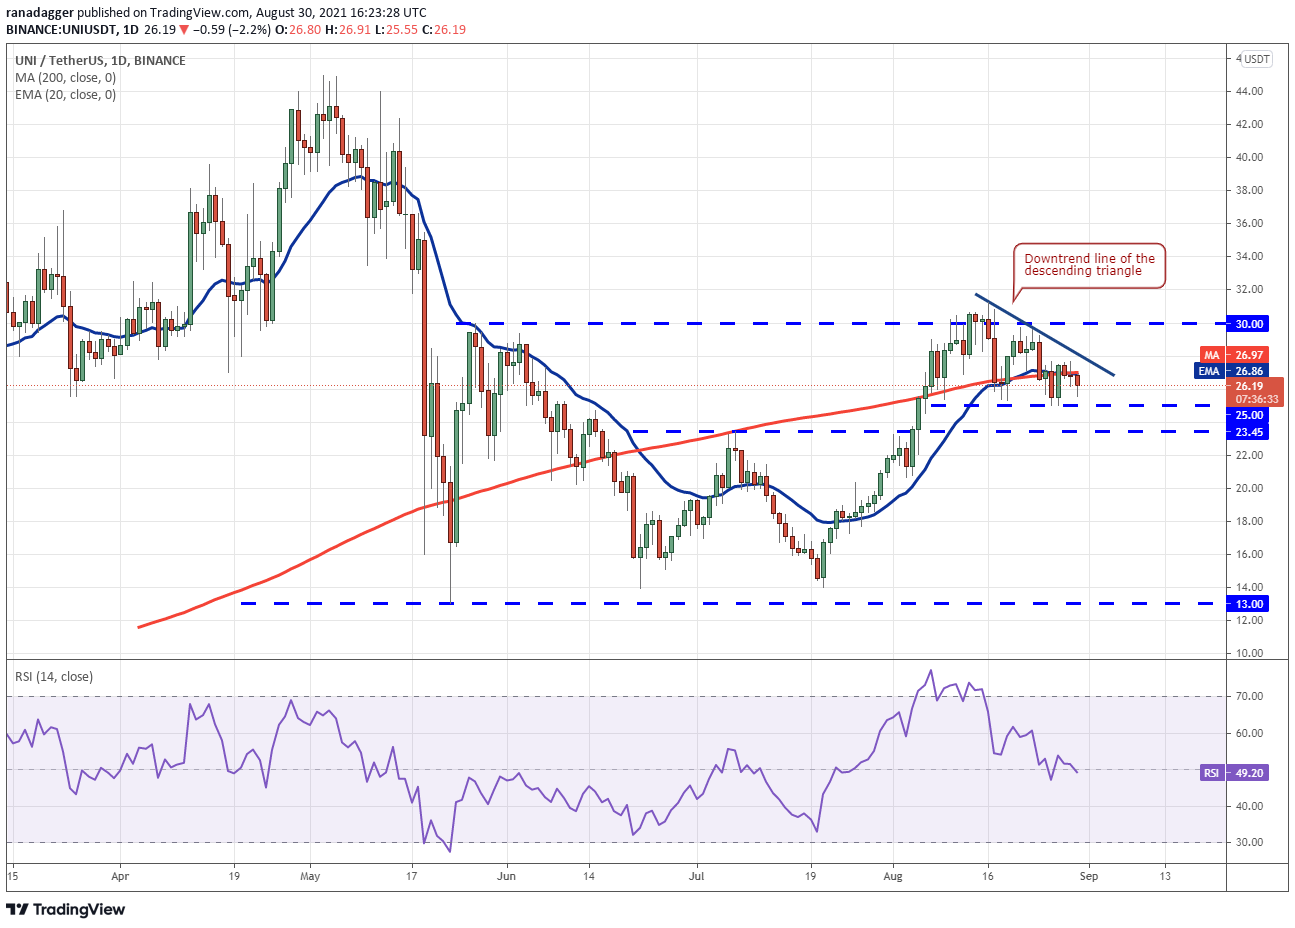 UNI/USDT daily chart. Source: TradingView
The price has dipped back below the moving averages today and the sellers will now try to pull the price below the support at $25. If that happens, the UNI/USDT pair will complete a small descending triangle pattern. This bearish setup has a target objective at $18.74.
Alternatively, if the price rebounds off the $25 support and breaks above the downtrend line, it will invalidate the bearish setup. The pair could then rise to $30. The bulls will have to push and sustain the price above this resistance to signal the start of a new uptrend.
LUNA/USDT
Terra protocol’s LUNA rallied to a new all-time high on Aug. 29 but traders used this rise to book profits. The price turned down today but bounced sharply from $32, indicating that bulls had flipped the previous resistance into support.
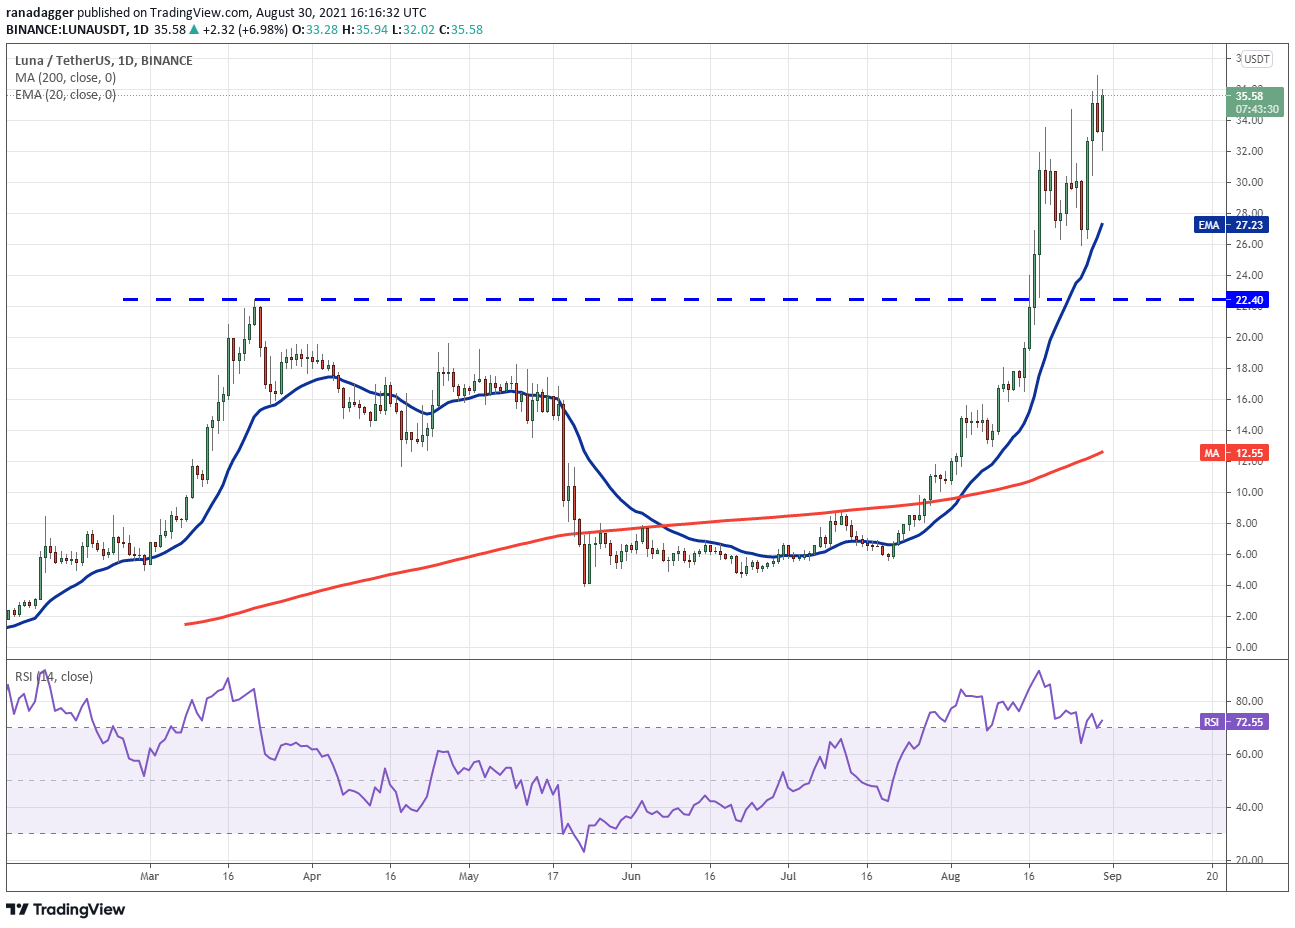 LUNA/USDT daily chart. Source: TradingView
The buyers will now try to push the price above the all-time high at $36.89. If they manage to do that, the LUNA/USDT pair could start its journey toward the next target objective at $43 and later to $50.
Contrary to this assumption, if the price again turns down from $36.89, the bears will try to sink the pair to the 20-day EMA ($27.23).
A strong rebound off this support will suggest that the sentiment remains positive and traders are buying on dips. The bulls will then again try to resume the up-move. The bears will have to pull and sustain the price below the 20-day EMA to weaken the bullish momentum.
The views and opinions expressed here are solely those of the author and do not necessarily reflect the views of Cointelegraph. Every investment and trading move involves risk. You should conduct your own research when making a decision.
Market data is provided by HitBTC exchange.