Cardano (ADA) was among the best performers among the top cryptocurrencies on June 6 as traders assessed a key upgrade that promises to enhance its blockchain’s smart contract capabilities.
Vasil hard fork FOMO
Dubbed “Vasil,” the so-called hard fork event will tentatively take place on June 29, 2022. As a result of the euphoria surrounding this upgrade, traders have started speculating more on ADA’s upside prospects, resulting in its better performance than other top-ranking digital assets.
For instance, ADA’s price rose by over 14% to $0.64 on June 6 compared to the 6% gains of its top rival, Ether (ETH), on the same day.
Thanks to the excitement surrounding its upcoming Vasil Hard Fork, #ADA surged over 20% to become one of the best-performing cryptos last week.
Prices as of now:#ADA – $0.637400#LINK – $7.98#XLM – $0.149126#UNI – $5.34
Buy/sell crypto futureshttps://t.co/QgaS0WtKde pic.twitter.com/1DWDxwFJ3Z
— BTCC (@YourBTCC) June 6, 2022
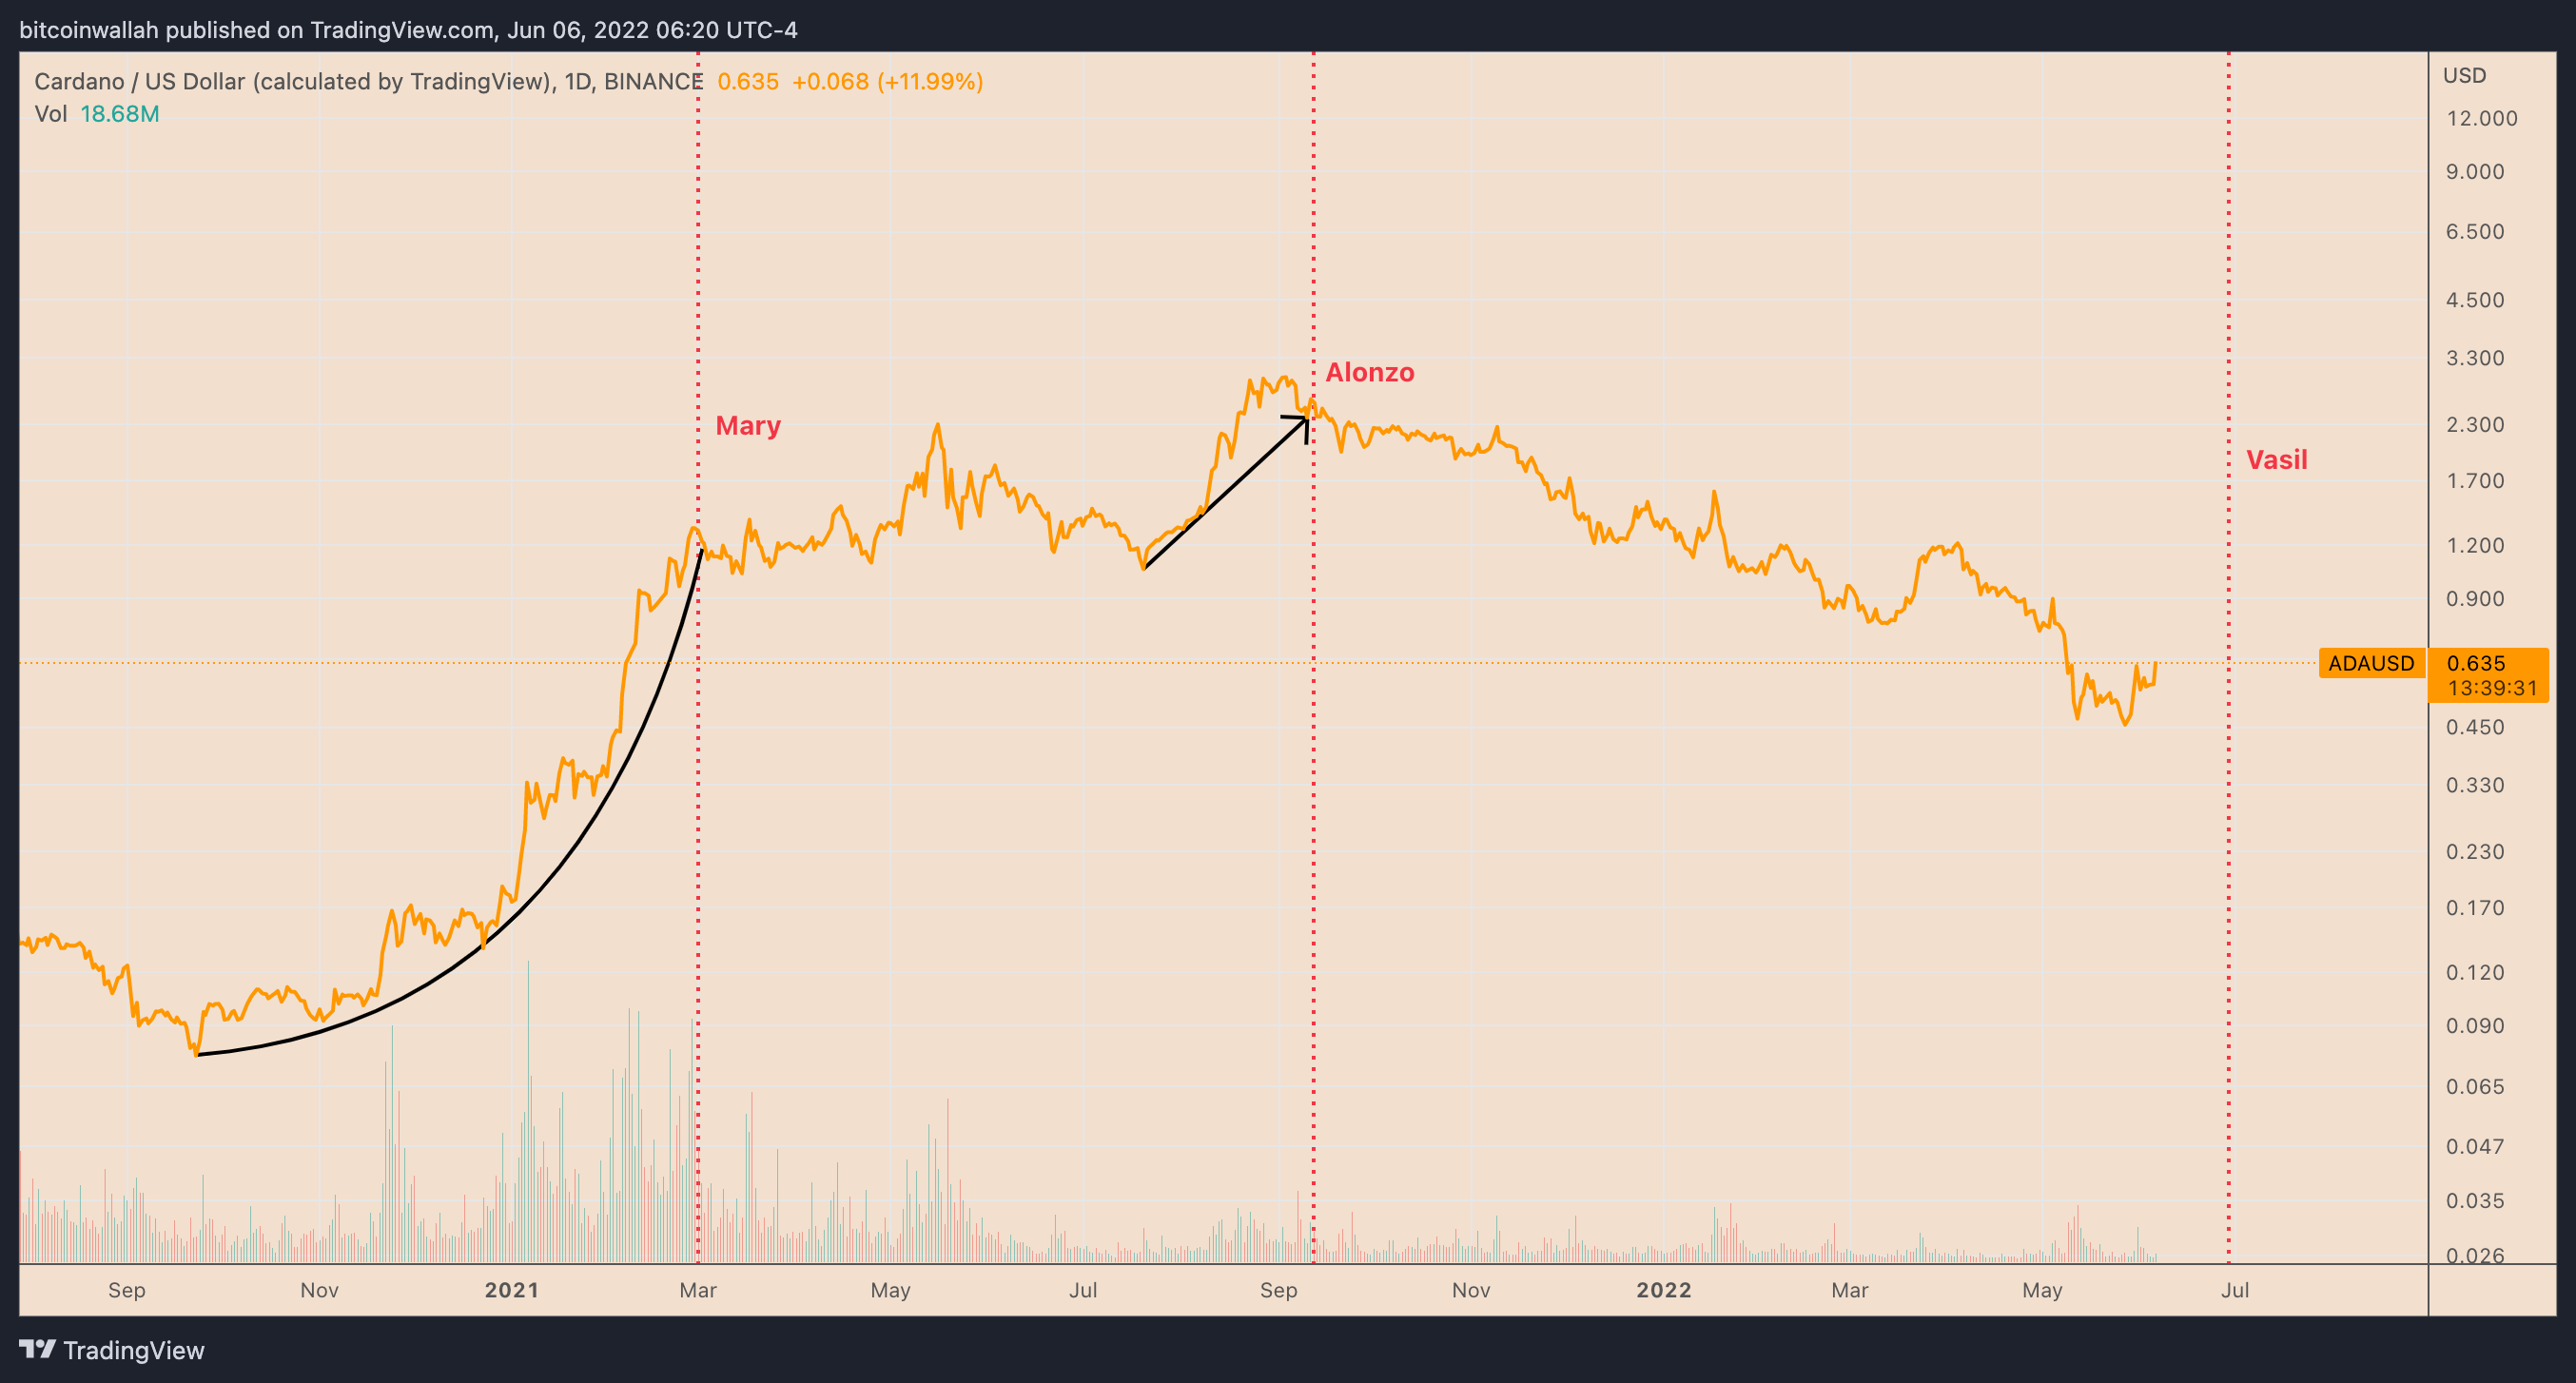
Cardano’s price history also shows similar euphoric behaviors among traders in the days leading up to hard fork events. For example, the “Alonzo” upgrade in September 2021, which introduced smart contract functionalities to the Cardano network, preceded a 200%-plus ADA price rally, as shown below.
 ADA/USD daily price chart. Source: TradingView
Similarly, Cardano’s “Mary” hard fork in March 2021 preceded ADA’s 1,600%-plus price boom.
ADA bull traps
The previous price rallies that led to the hard fork events also occurred amid an expansionary macro-environment. At the time, interest rates were near-zero, and the Federal Reserve was buying $120 billion worth of government bonds every month.
But currently, the U.S. central bank has turned hawkish after witnessing persistently higher inflation. Therefore, many analysts argue that there is now less U.S. dollar liquidity to buy riskier assets, including stocks and cryptos.
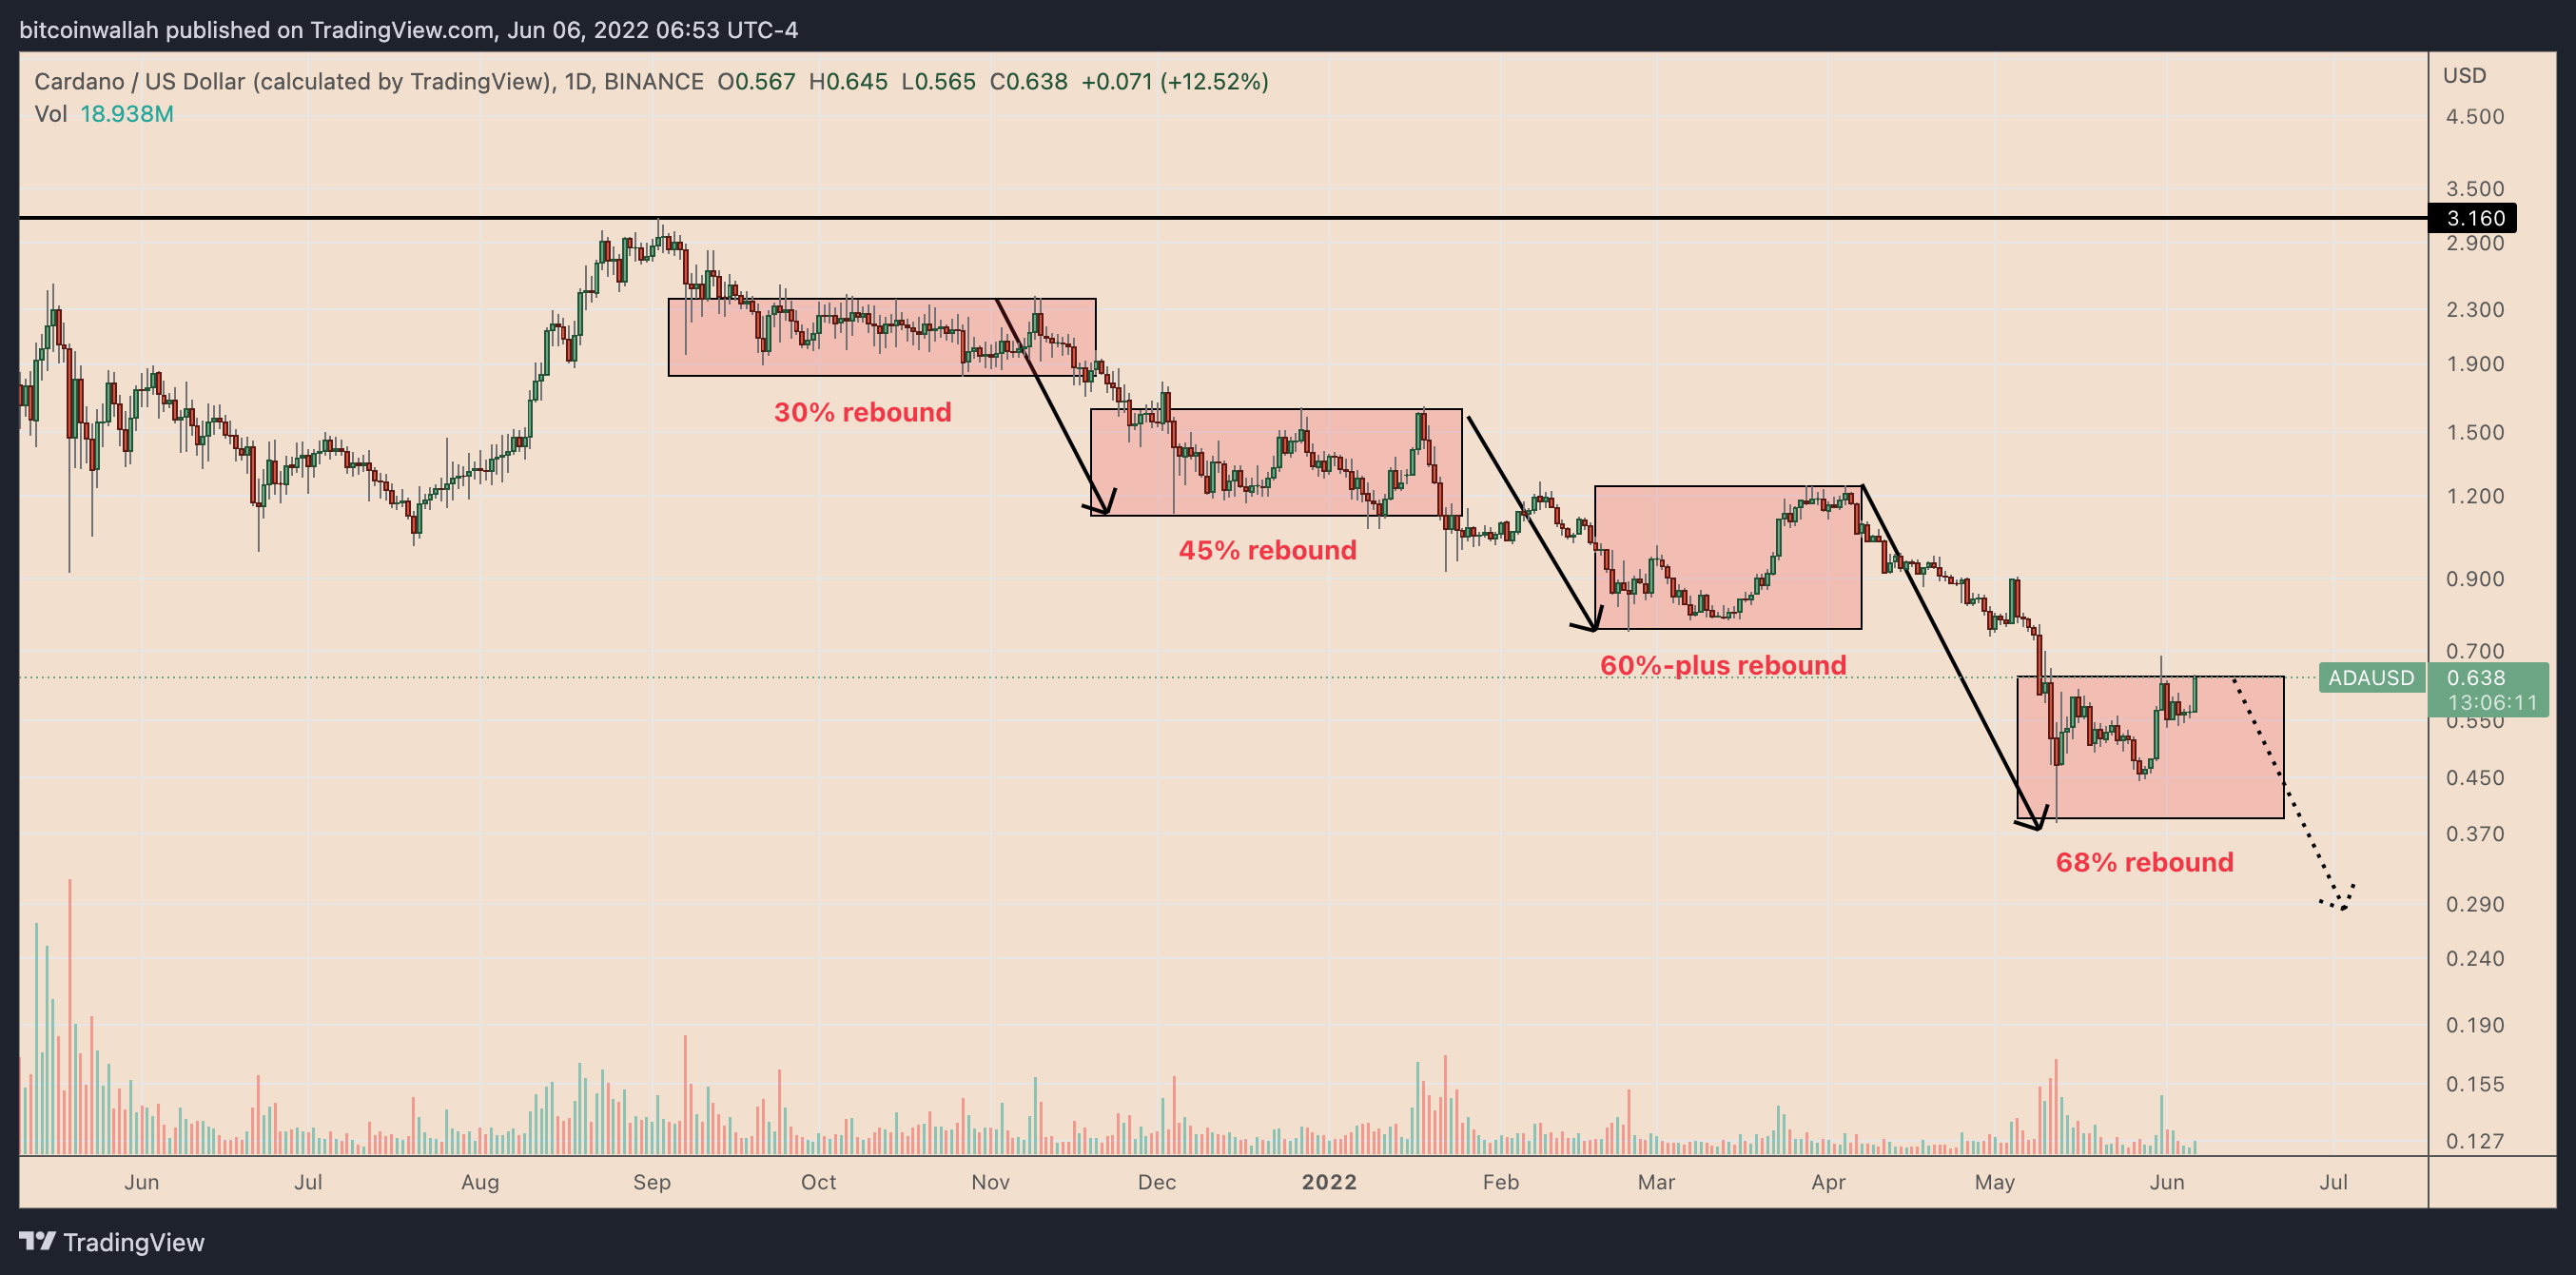
Cardano has reeled under the pressure of the Fed’s tightening, with ADA trading almost 80% lower than its September 2021 peak of $3.16. The broader move downside also includes significant bounces, as shown in the chart below.
 ADA/USD daily price chart featuring price rebounds in ongoing bear market. Source: TradingView
ADA price to $1?
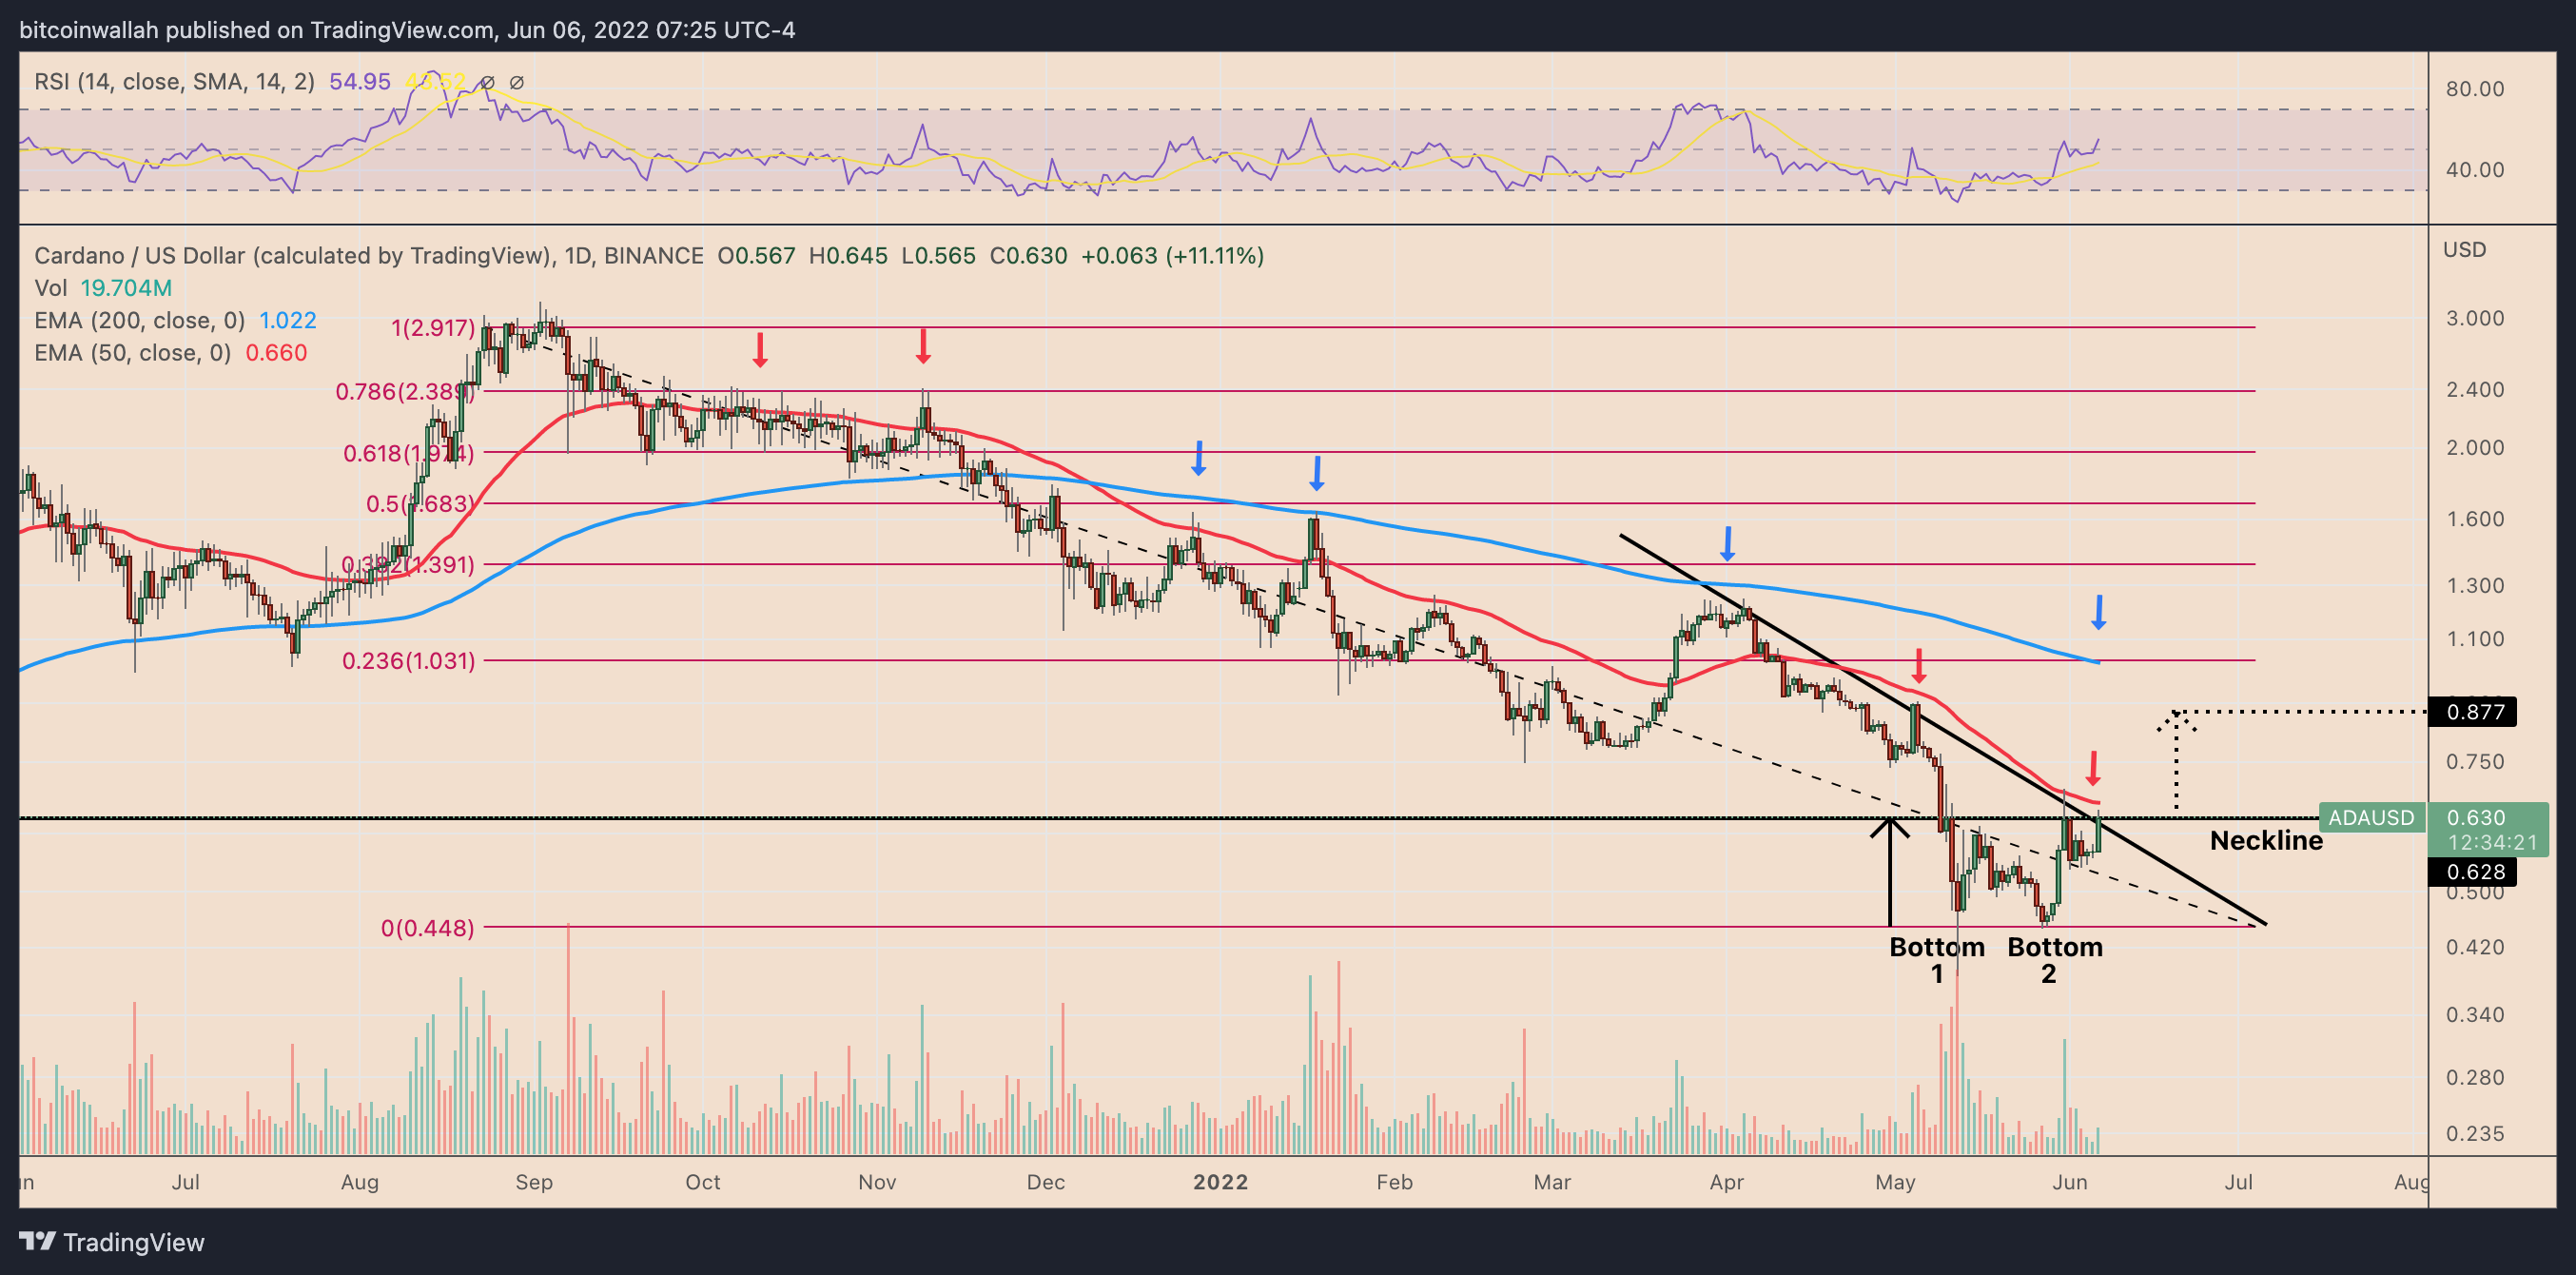
From the technical perspective, ADA now tests a resistance confluence comprising a falling trendline and its 50-day exponential moving average (50-day EMA; the red wave) near $0.66 and a horizontal trendline (the neckline) near $0.62 that constitutes what appears to be a “double bottom” pattern.
 ADA/USD daily price chart featuring ‘double bottom’ setup. Source: TradingView
A break above the resistance confluence could trigger the double bottom breakout.
Related: Crypto funds under management drop to a low not seen since July 2021
As a rule of technical analysis, traders measure the double bottom’s breakout target by adding the distance between the bottom levels and the neckline to the breakout point. That paints a June target of $0.87, up around 40% from today’s price and likely ahead of the Vasil upgrade.
A follow-up rally could also see ADA testing its 200-day exponential moving average (200-day EMA; the blue wave) near $1 for a breakout or pullback. A pullback seems more likely, however, given the prevailing macro risks.
The views and opinions expressed here are solely those of the author and do not necessarily reflect the views of Cointelegraph.com. Every investment and trading move involves risk, you should conduct your own research when making a decision.


