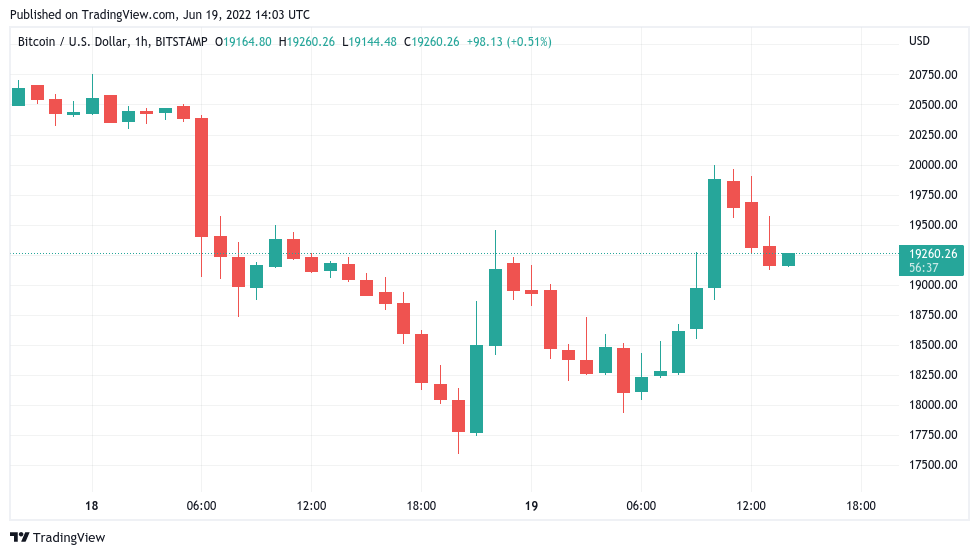
Bitcoin (BTC) attempted to reclaim $20,000 as support on June 19 as bulls faced a $7,000 weekly red candle.
 BTC/USD 1-hour candle chart (Bitstamp). Source: TradingView
$16,000 eyed for possible next move
Data from Cointelegraph Markets Pro and TradingView showed BTC/USD rising from lows of $17,592 on Bitstamp before being firmly rejected at $20,000.
Low-liquidity trading conditions had made for a grim weekend for hodlers as the largest cryptocurrency fell to levels not seen since November 2020.
While recovering some losses, a sense of deja vu pervaded the market on the day. $20,000 had returned as resistance, this having formed an all-time high for Bitcoin for three years from December 2017 to December 2020.
It was also the first time that BTC/USD had retreated under a previous halving cycle’s all-time high.
There’s a first first everything. This is the first time Bitcoin has traded below prior cycle highs. I think it’s fair to say things are different now.
— Charles Edwards (@caprioleio) June 18, 2022
While some panicked, however, seasoned market participants remained broadly understanding of recent price action, which still corresponded with historical bear market patterns.
“To put things into perspective: A Bitcoin crash of 74% as at present is nothing unusual,” markets commentator Holger Zschaepitz acknowledged.
“In history, there have already been 4 collapses in which the leading cryptocurrency went from peak to trough by >80%.”
In terms of what could like ahead, attention focused on $17,000 as a potential short-term target. A short squeeze higher, as popular Twitter account Credible Crypto noted, was not on the menu.
Looks like no squeeze first. Well then, let’s rip the bandaid off and get this over with! https://t.co/xliurgtPrO
— CrediBULL Crypto (@CredibleCrypto) June 18, 2022
Fellow trader and analyst Rekt Capital meanwhile added that Bitcoin’s 200-week moving average (MA), a key support line in bear markets, was still functioning as before.
No matter how much of an extreme time this seems to be for #BTC
Historically $BTC tends to wick between -14% to -28% below the 200-week MA
BTC has wicked -21% below the 200 MA so far, still within the historical range & not out of the ordinary in that respect#Crypto #Bitcoin pic.twitter.com/cJm5A9yYYO
— Rekt Capital (@rektcapital) June 19, 2022
Sellers offload coins at a record loss
At around $7,000, however, the week’s red candle was set to be the one of the largest in Bitcoin’s history in dollar terms.
Related: GBTC premium hits -34% all-time low as crypto funds ‘puke out’ tokens
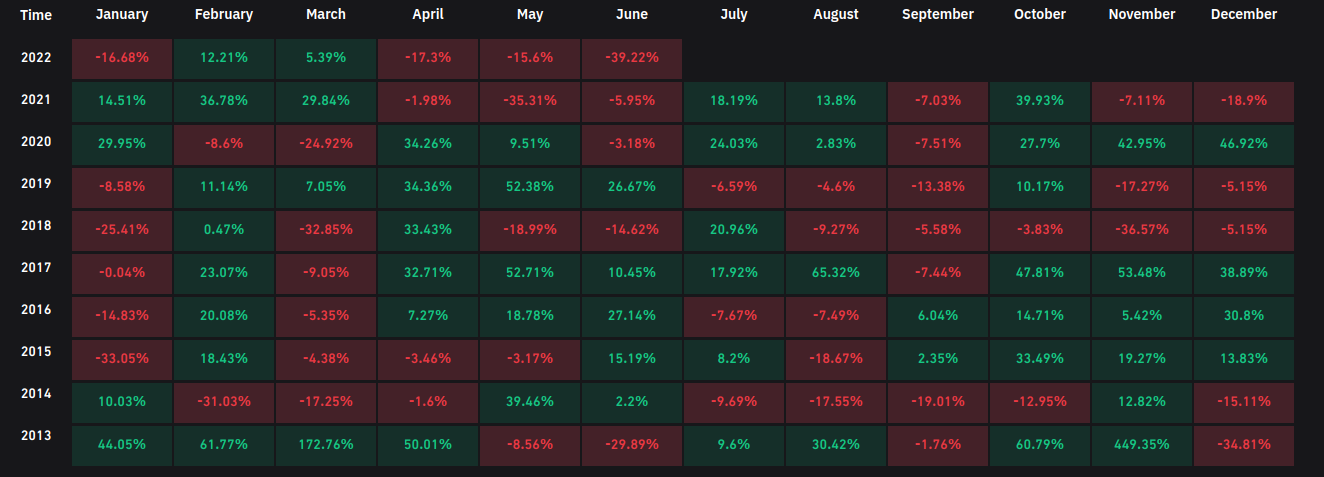
 BTC/USD monthly returns chart. Source: Coinglass
Data from on-chain analytics platform Coinglass added that June 2022 was shaping up to be the worst on record, beating even 2013 in terms of losses.
The last three consecutive days have been the largest USD denominated Realized Loss in #Bitcoin history.
Over $7.325B in $BTC losses have been locked in by investors spending coins that were accumulated at higher prices.
A thread exploring this in more detail
1/9 pic.twitter.com/O7DjSK2rEQ— glassnode (@glassnode) June 19, 2022
As a sign of investor pressure resulting from spot price performance, more BTC was sold at a loss in the three days to June 19 than at any other time, according to figures from on-chain analytics firm Glassnode.
Additional concerns focused on the financial buoyancy of Bitcoin miners. Not everyone, however, agreed that network participants were feeling the pinch to the extent that capitulation would result.
The views and opinions expressed here are solely those of the author and do not necessarily reflect the views of Cointelegraph.com. Every investment and trading move involves risk, you should conduct your own research when making a decision.


