Bitcoin (BTC) lingered near $30,000 on June 22 as traders sought opportunities to “buy the dip.”

Bitcoin dip-buyers “ready” for $28,000
Data from Cointelegraph Markets Pro and TradingView showed BTC/USD volatility calming overnight after rapid gains.
BTC price performance had impressed the day before, with the largest cryptocurrency returning to the $30,000 mark for the first time since mid-April.
Now, hopes were increasing over a modest correction next, enabling lucrative entry points for further long positions.
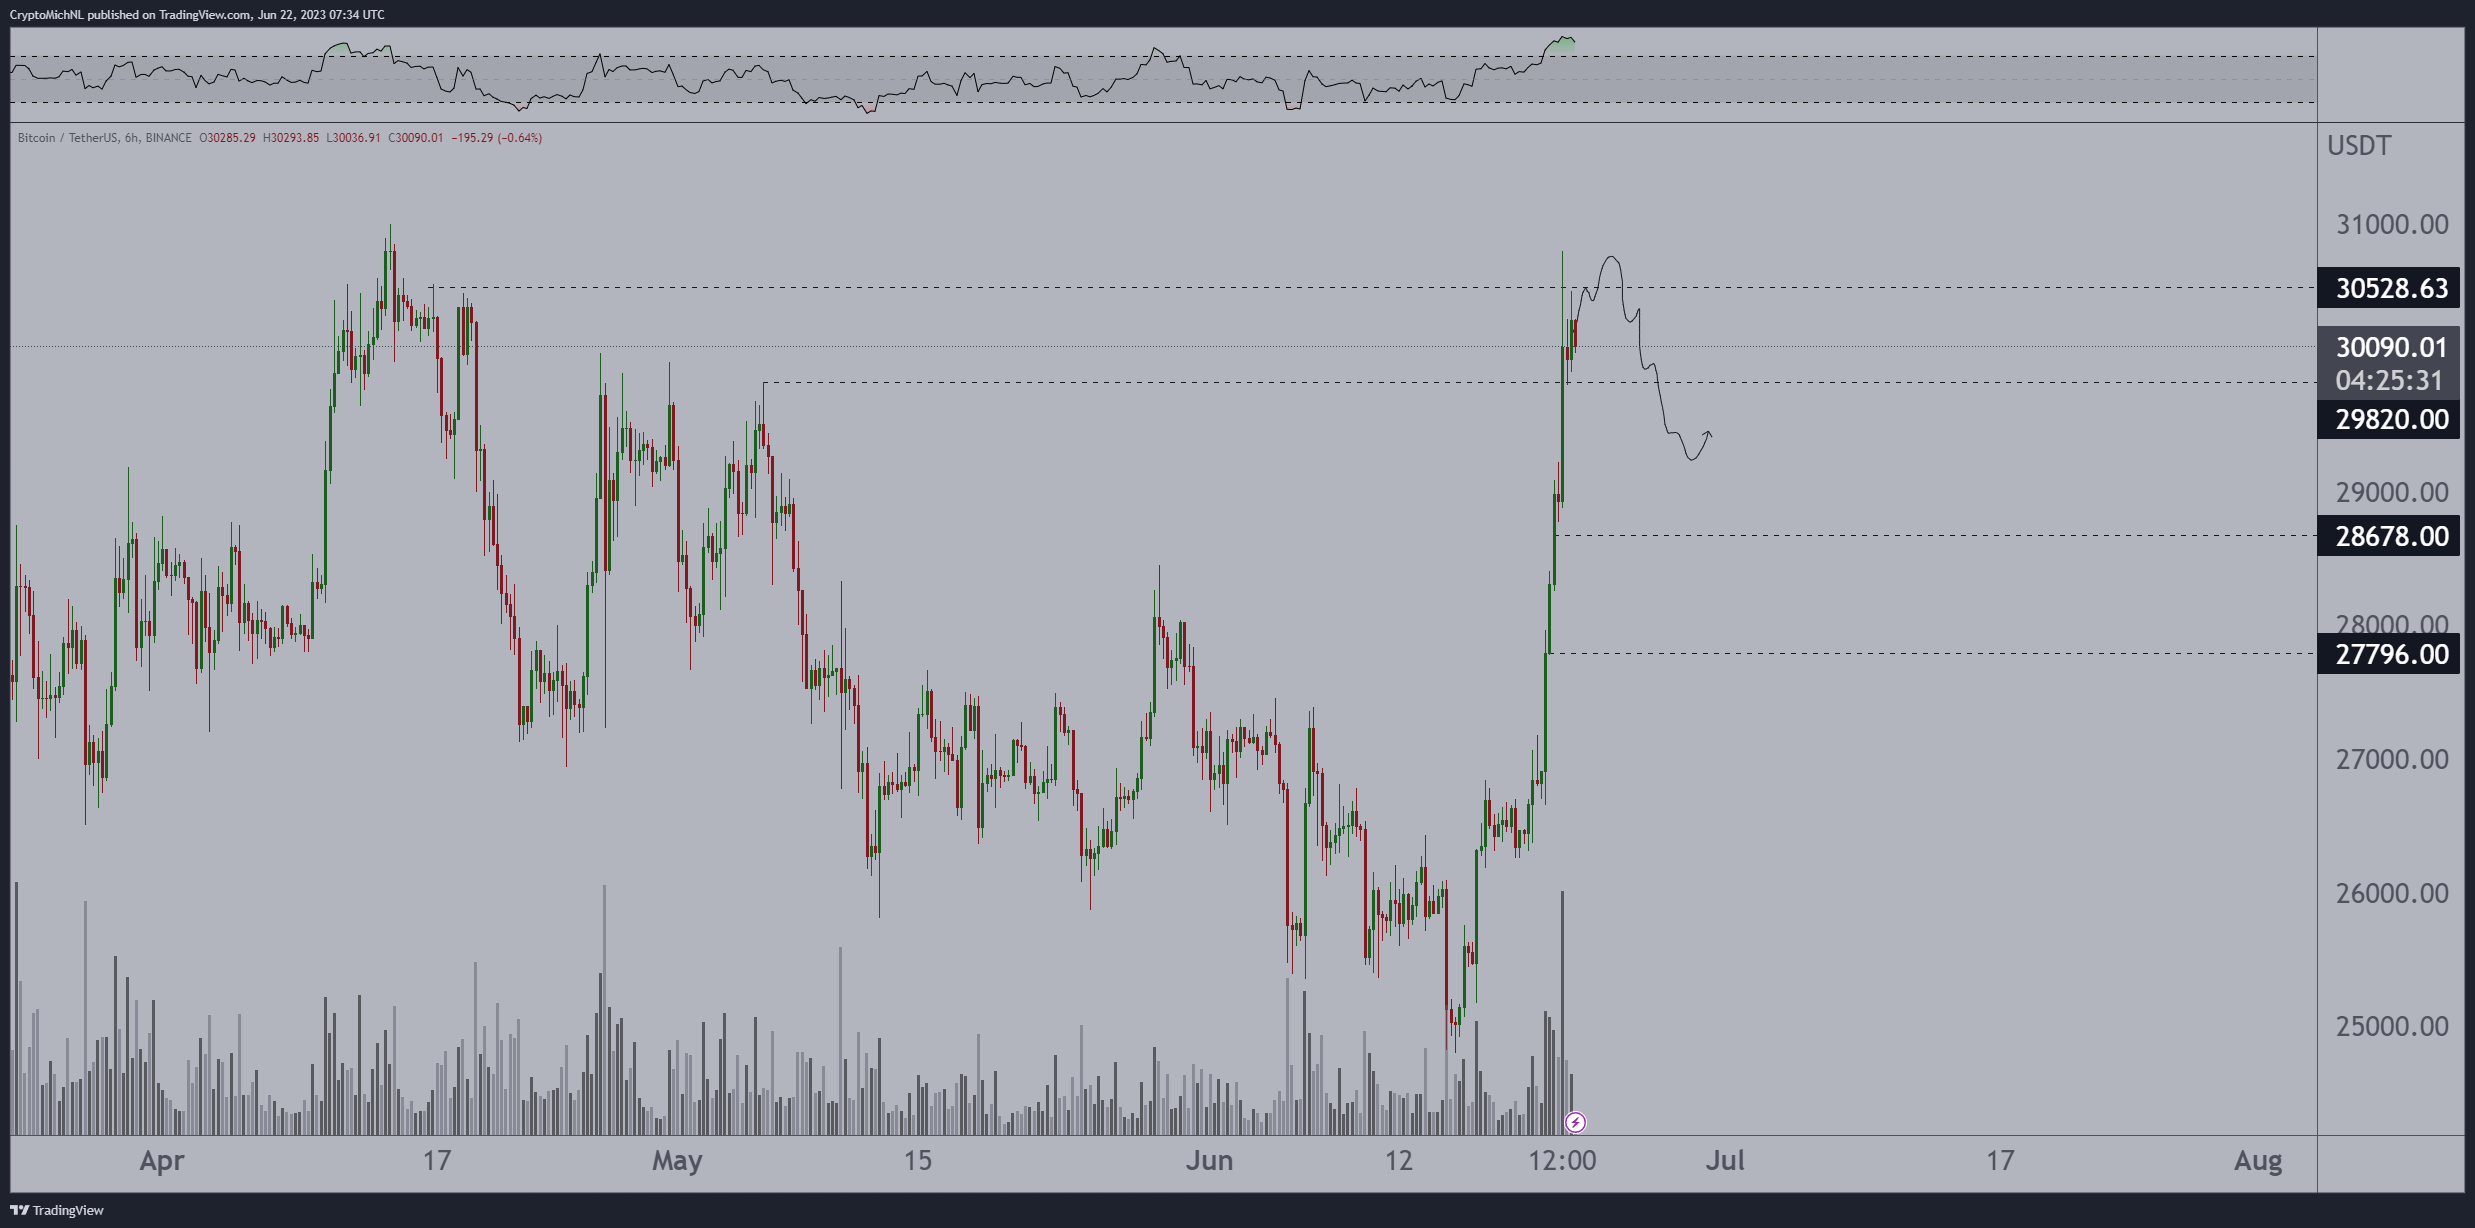
Not shorting, waiting for an entry lower. pic.twitter.com/WgIibKQAs9
— Ed_NL (@Crypto_Ed_NL) June 22, 2023
“Bitcoin looking at this scenario,” Michaël van de Poppe, founder and CEO of trading firm Eight, told Twitter followers.
“I think, $28.500 is a great spot for longing, the lower the better, but I think that’s the zone where you want to get it before we’ll continue to $40,000.”
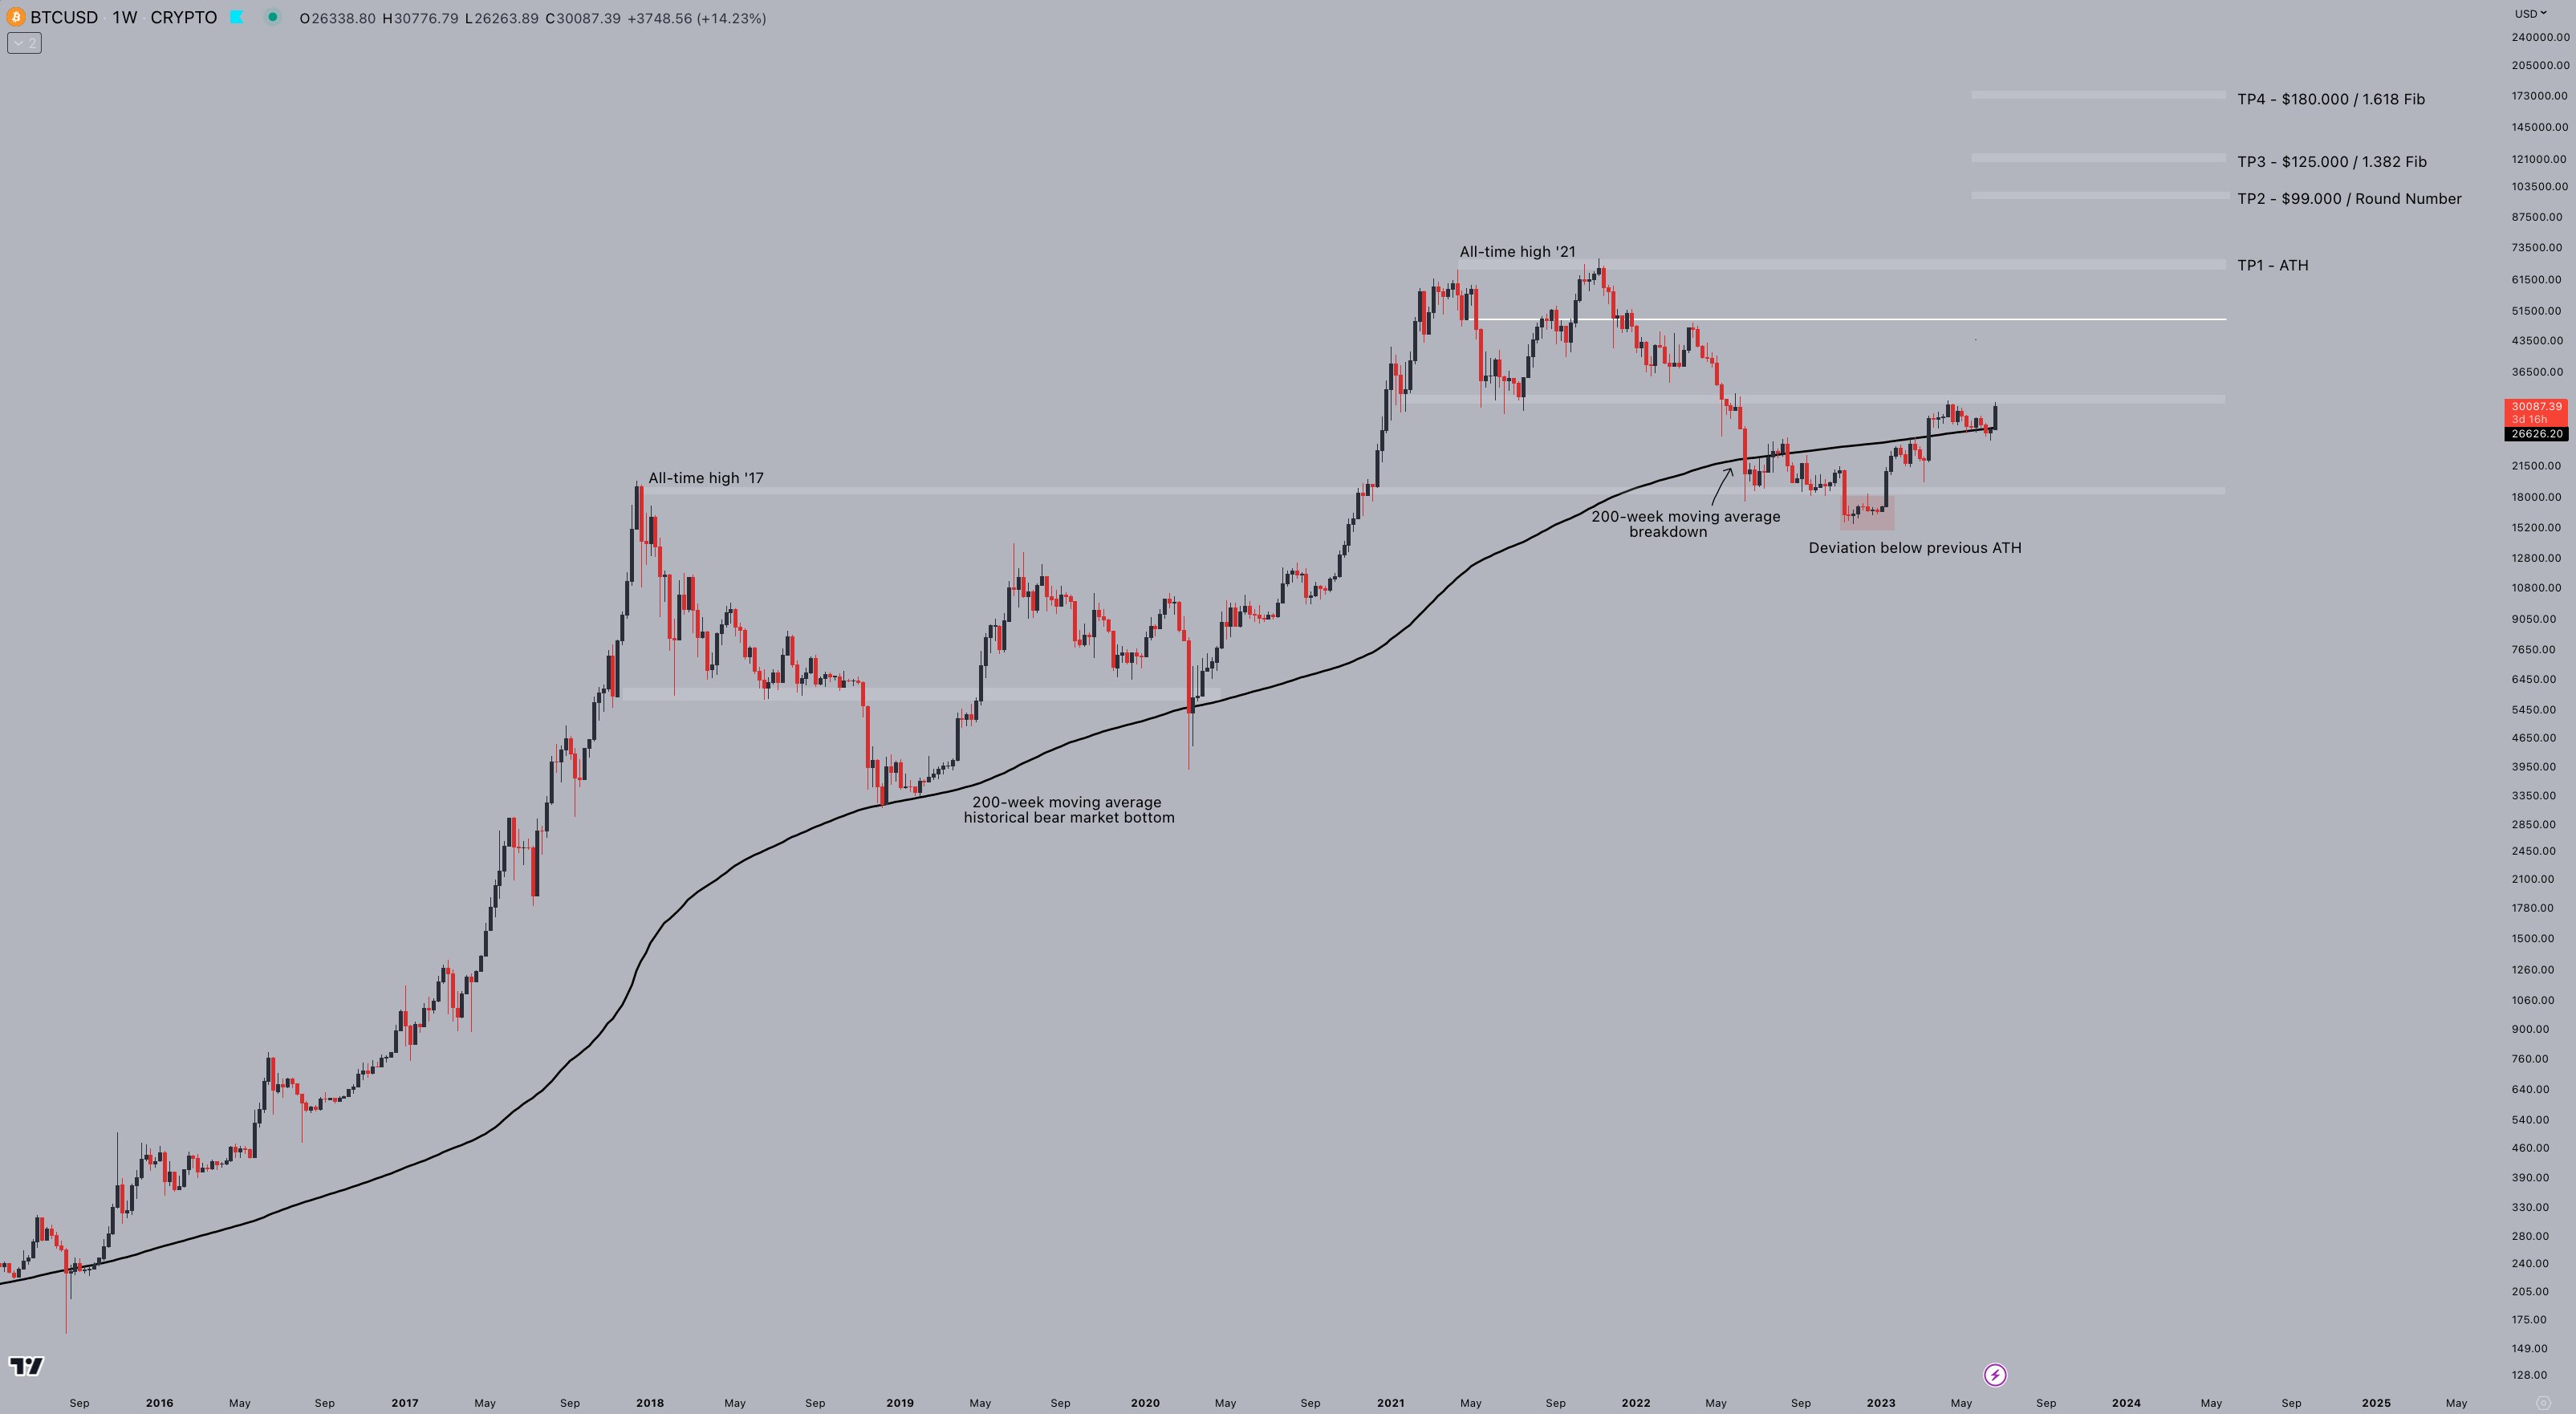
Fellow trader Crypto Tony maintained a more modest target of $32,000 next, while Jelle considered longer-term levels far beyond — including past the current $69,000 all-time high.
“After the falling wedge breakout, we are now back at the key resistance: $30,000,” part of the day’s analysis read.
“Price seems to be stalling a bit, which suggests we may get some dip-buying opportunities soon. Watching $29,000 and $28,000 personally – ready to bid if we get it.”
BTC price volatility “no exception” to norm
Analyzing the nature of the past days’ upside, meanwhile, on-chain analytics firm Glassnode argued that Bitcoin was doing nothing out of the ordinary.
Related: Grayscale Bitcoin Trust nears 2023 highs on BlackRock ETF filing as buyers step up
Volatility had followed an extended period of sideways BTC price action, which has been familiar to many other breakouts.
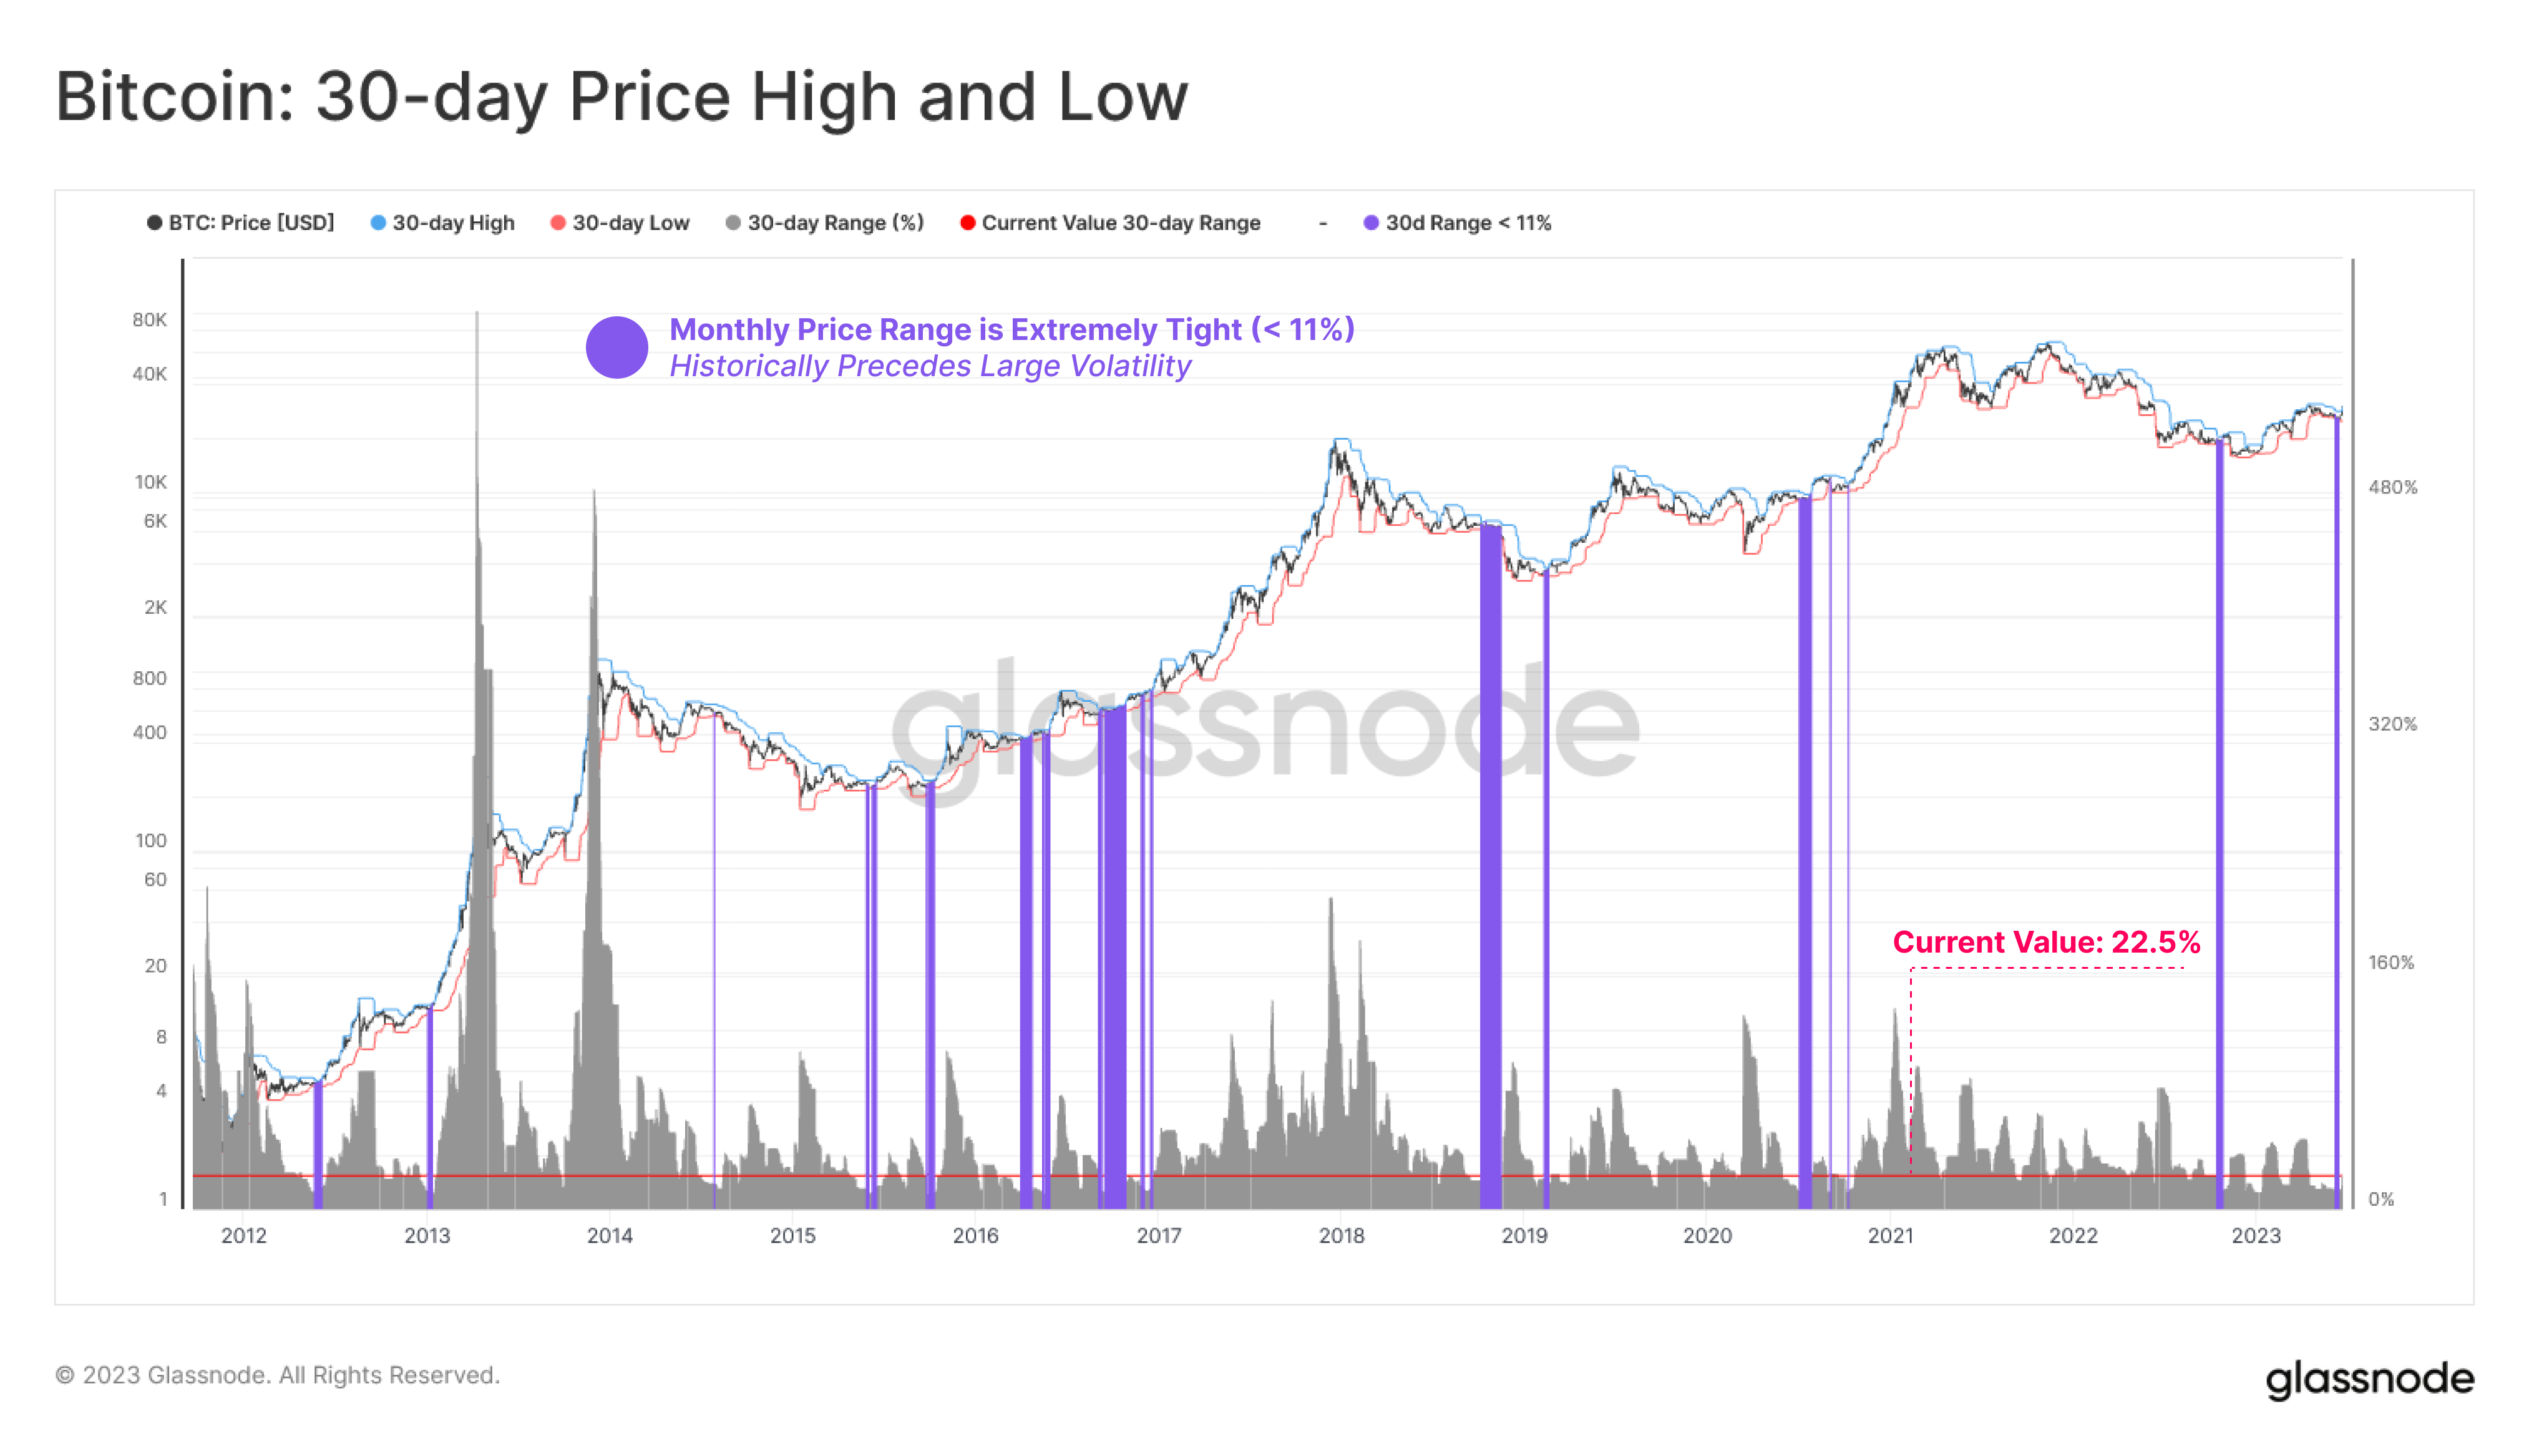
A chart uploaded to Twitter showed 30-day highs and lows over the years, with the previous month described as “extremely tight.“
“Historically, extremely tight trading ranges have preceded large, volatile moves in either direction,” Glassnode commented.
“Thus the 30-day Bitcoin High and Low price range can be utilized as a prescient indicator for detecting incoming volatility, with the most recent rally being no exception.“
Magazine: Bitcoin is on a collision course with ‘Net Zero’ promises
This article does not contain investment advice or recommendations. Every investment and trading move involves risk, and readers should conduct their own research when making a decision.