Bitcoin (BTC) further reduced volatility ahead of the July 30 weekly close as traders eyed an exciting long-term bull signal.
BTC price makes weekend “slower than ever”
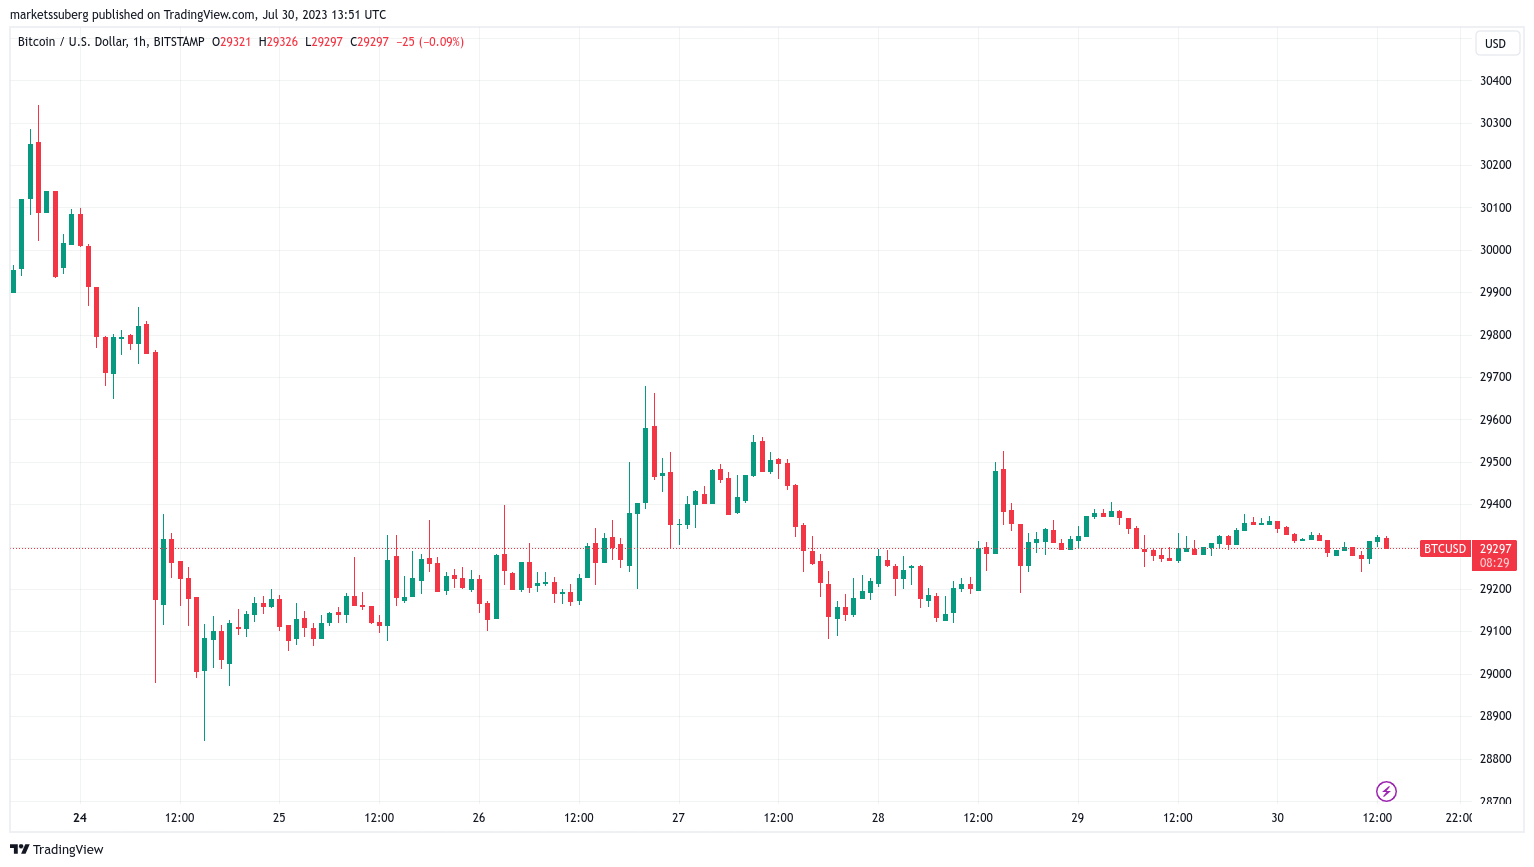
Data from Cointelegraph Markets Pro and TradingView followed sideways BTC price action over the weekend, with BTC/USD sticking in a tiny $150 range.
#Bitcoin Trading within a $10 range for the past 1.5 hours.
Weekends are slower than ever lately. pic.twitter.com/FmZLL82wrk
— Daan Crypto Trades (@DaanCrypto) July 29, 2023
Conditions throughout the week had remained calm, despite a slew of macroeconomic data events, leading some to assume that a breakdown would come next.
With hours until the weekly close, however, there was still no sign of volatility returning.
#BTC exhibiting impressive price stability around the ~$29250 for most of the week$BTC #Crypto #Bitcoin https://t.co/QB6iHS2gsT pic.twitter.com/mnoDg7ltpx
— Rekt Capital (@rektcapital) July 28, 2023
“Price action has not been this compressed since the very start of 2023. The longer this goes on, the bigger the move will be that follows it,” popular trader Daan Crypto Trades argued in part of the weekend’s commentary.
As Cointelegraph reported, Bitcoin’s Bollinger Bands currently echo conditions from the start of the year, just before BTC price went on to gain 70% in the first quarter.
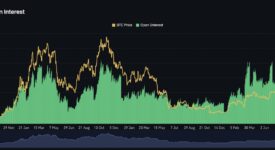
Analyzing movements among traders on the Binance BTC/USD order book, monitoring resource Material Indicators noted that buying pressure from whales was combining with increasing resistance closer to $30,000.
“Expecting guard rails to stay up until we near the Weekly and Monthly candle closes,” part of accompanying comments stated on July 29.
Bitcoin monthly MACD cross firmly on the radar
A more exciting topic came in the form of a potential bullish cross on Bitcoin’s moving average convergence/divergence (MACD) indicator.
Related: Bitcoin bull run next? Bitfinex stablecoin ratio ‘blows up’ in 2023
On monthly timeframes, various market observers noted, such a bull flag was inches from confirmation, and should historical patterns repeat, upside should result in future.
#Bitcoin is 1.5 days away from locking in a monthly bullish MACD cross pic.twitter.com/aV2vCmWOaJ
— Jelle (@CryptoJelleNL) July 30, 2023
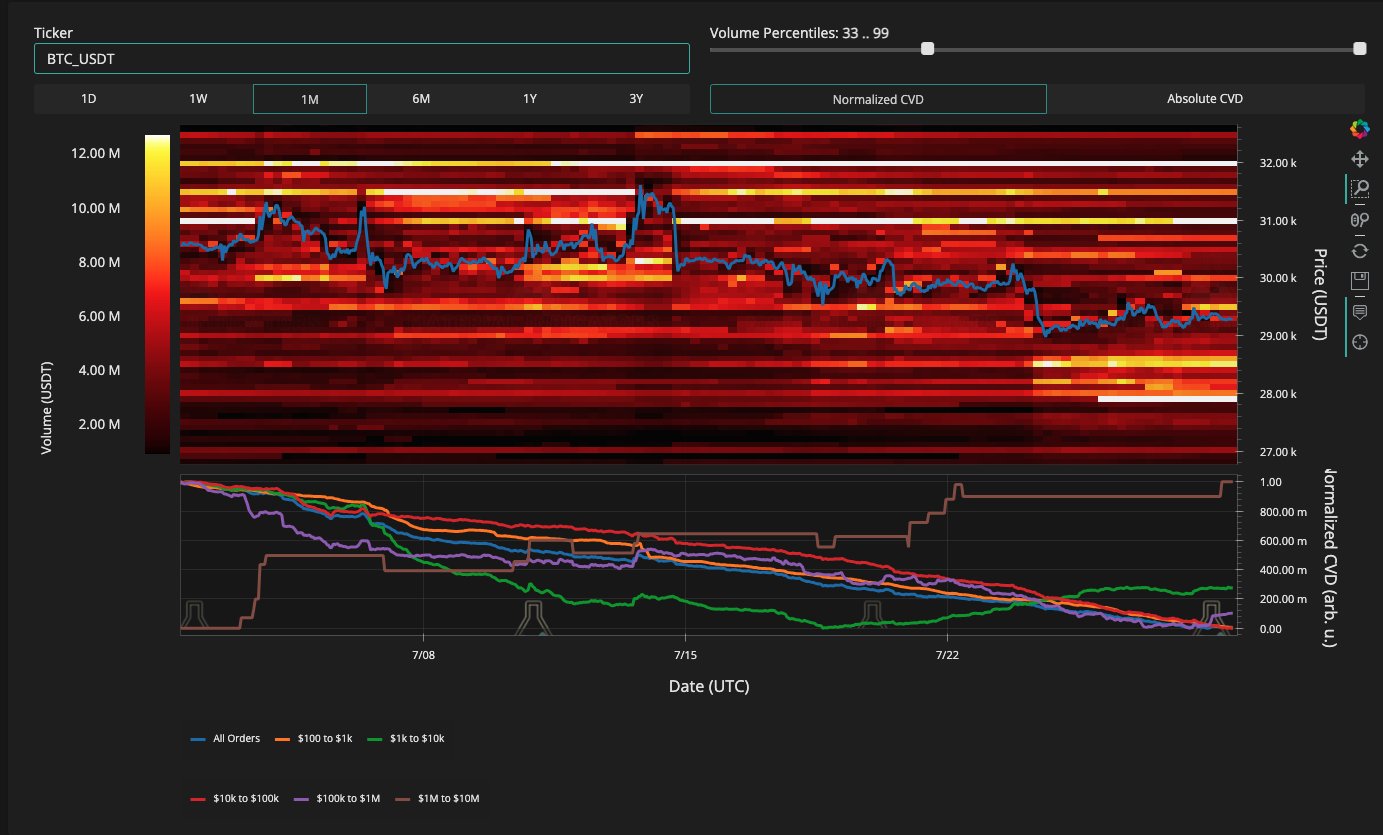
Trading resource Stockmoney Lizards was also hopeful for the cross’s positive implications, but nonetheless acknowledged that its appearance “doesn’t mean btc is already out of its summer correction mode.”
An accompanying chart showed a prior monthly MACD cross from late 2015 heralding preparations for Bitcoin’s ascent to last cycle’s $20,000 all-time high two years later.
While lower-timeframe MACD crosses can be false alarms, a weekly cross in August 2021 preempted the move to Bitcoin’s current all-time highs in November that year.
Magazine: Experts want to give AI human ‘souls’ so they don’t kill us all
This article does not contain investment advice or recommendations. Every investment and trading move involves risk, and readers should conduct their own research when making a decision.