Demand and supply metrics determine the price of an asset and data from Glassnode, an on-chain data firm, shows that Bitcoin’s (BTC) liquid supply has been decreasing since June 2020. This signals that traders owning Bitcoin are not selling their holdings.
While the supply is shrinking, demand has been going up in the past few months as an increasing number of institutional investors have been buying Bitcoin.
Bloomberg recently reported that Morgan Stanley Investment Management’s subsidiary Cointerpoint Global “is exploring whether the cryptocurrency would be a suitable option for its investors.”
According to Morgan Stanley’s website, Counterpoint Global chooses to invest in assets “whose market value can increase significantly for underlying fundamental reasons.” This suggests that the bank believes Bitcoin may be undervalued compared to its fundamentals.
 Crypto market data daily view. Source: Coin360
JPMorgan Chase also hinted that it might eventually introduce Bitcoin services. JPMorgan’s co-president Daniel Pinto believes that if investors and asset managers start using Bitcoin, the bank “will have to be involved.” Pinto however said that the current demand was not strong enough, but conceded it may grow in the future.
Even though Bitcoin has risen sharply in the past few months, its dominance has fallen from about 69.71% on Jan. 4 to 60.9% currently. This shows that altcoins have outperformed Bitcoin in the past few weeks. With an eye on altcoins, let’s study the charts of the top-5 cryptocurrencies that may trend in the next few days.
BTC/USD
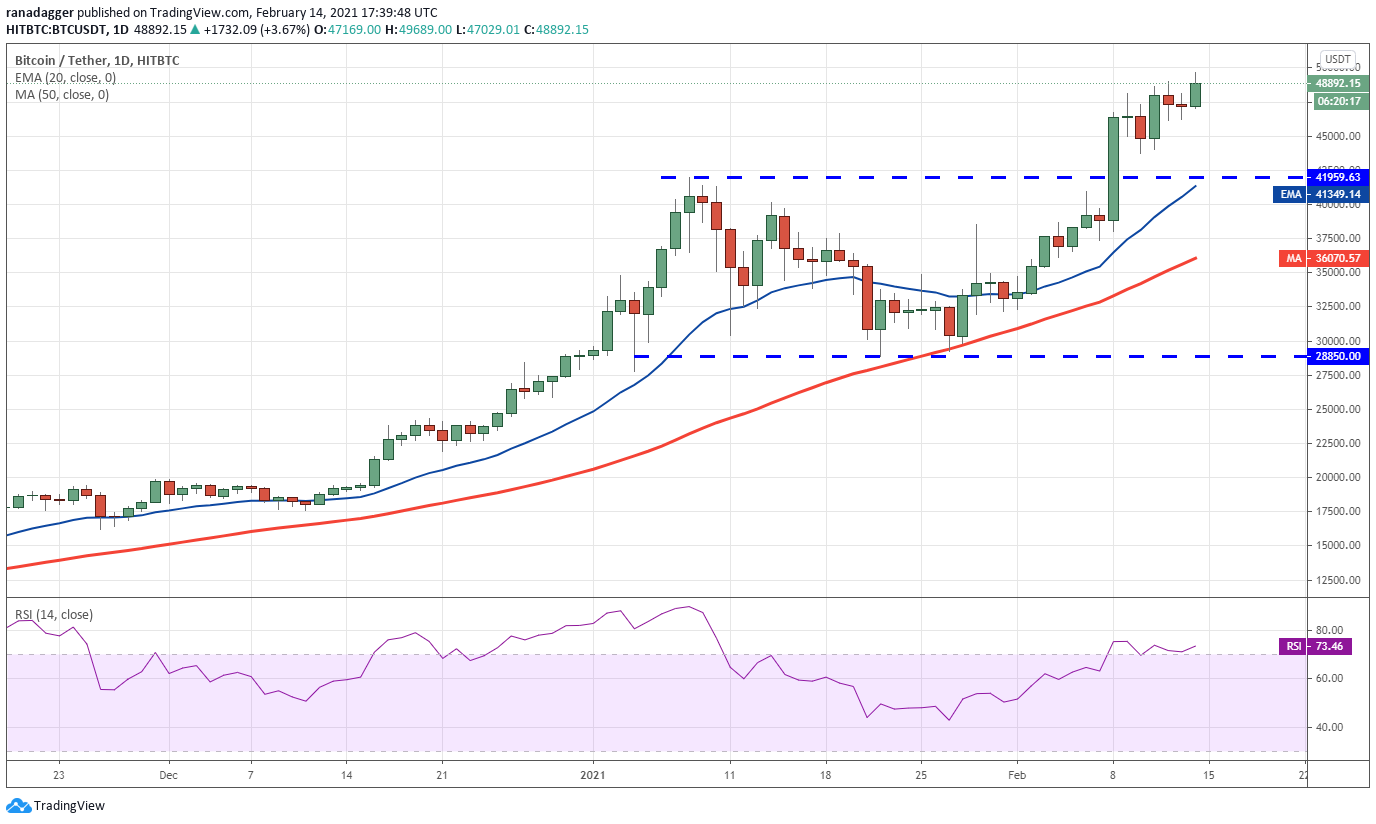
Bitcoin broke above the $41,959.63 resistance on Feb. 8 with a strong up-move, but since then, the momentum has weakened. Although the price has been nudging higher, the leading cryptocurrency is facing profit-booking at intermittent levels.
 BTC/USDT daily chart. Source: TradingView
If the price turns down from the current levels and slips below $46,000, the correction could deepen to the strong support at $41,959.63. If the BTC/USD pair rebounds off this support, it will suggest the bulls continue to accumulate on dips, which is a sign that the uptrend is intact.
The bulls will then try to drive the price above the psychological barrier at $50,000 and resume the uptrend with the next target objective at $60,974.43. On the other hand, if the bears sink the price below the 20-day exponential moving average ($41,349), the pair may drop to the 50-day simple moving average ($36,070).
This is an important support to watch out for because the price has not dipped below the 50-day SMA since Oct. 9. Hence, a break below it will indicate a possible change in trend. The next support on the downside is much lower at $28,850.
 BTC/USDT 4-hour chart. Source: TradingView
The 4-hour chart shows the pair has formed a rising wedge pattern that will complete on a breakdown and close below the support line. If that happens, the pair may drop to $43,720.85 and then to $41,959.63.
Contrary to this assumption, if the price turns up from the current levels or the 20-EMA and rises above the wedge, it will invalidate the bearish setup. A breakout above $50,000 could attract short-covering from the aggressive bears and may result in a quick up-move to $55,000.
BCH/USD
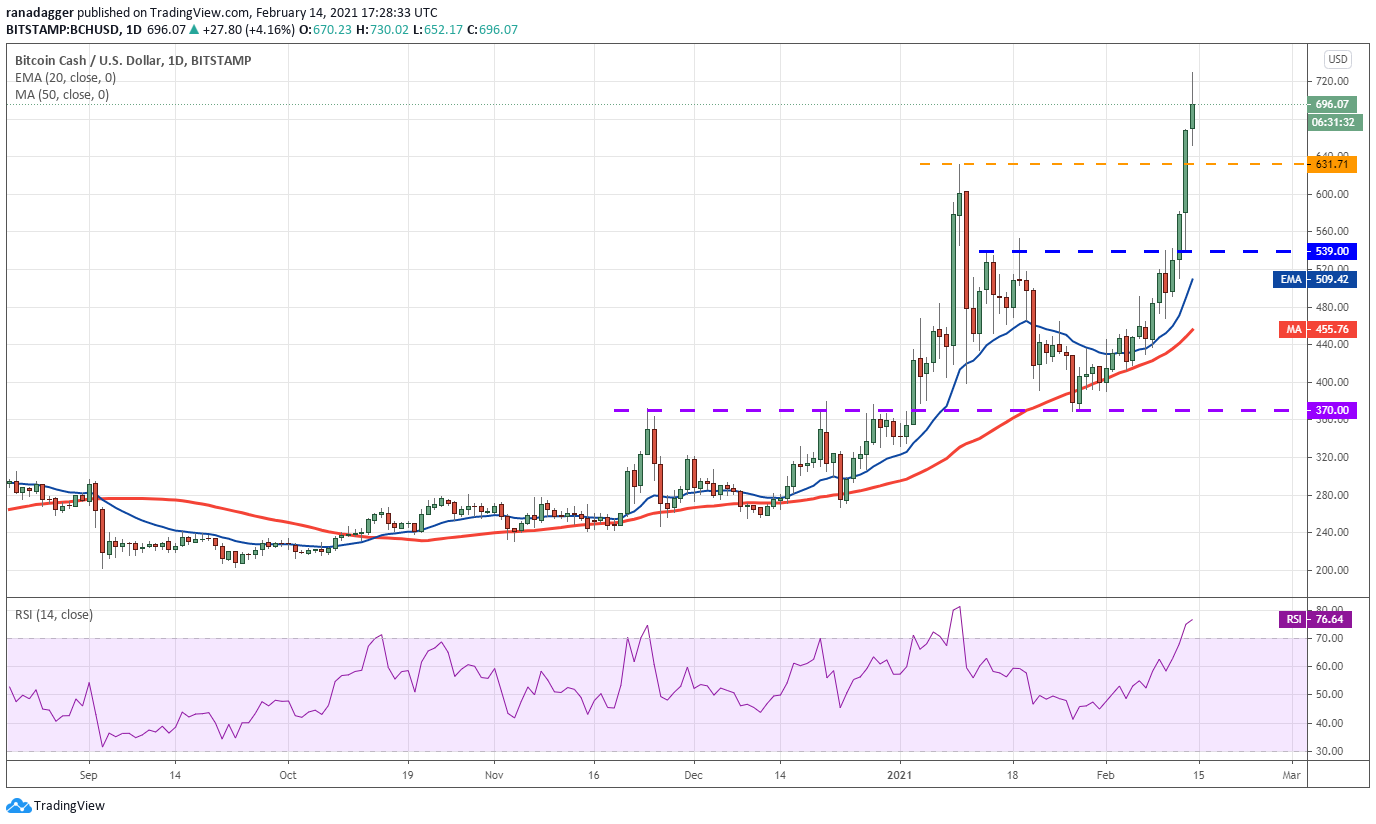
Bitcoin Cash (BCH) broke above the $539 resistance on Feb. 12 and this attracted buying from the bulls. The altcoin picked up momentum and soared above the $631.71 resistance on Feb. 13
 BCH/USD daily chart. Source: TradingView
The long wick on today’s candlestick suggests short-term traders may be booking profits after the recent runup. The BCH/USD pair may now correct to $631.71 and if the bulls can flip this level into support, it will indicate buying on every minor dip.
If the bulls can push the price above $730.02, the uptrend could reach $900. Both moving averages are sloping up and the relative strength index (RSI) is in the overbought zone, suggesting an advantage to the bulls.
Contrary to this assumption, if the price dips and sustains below $631.71, the correction could deepen to $539.
 BCH/USD 4-hour chart. Source: TradingView
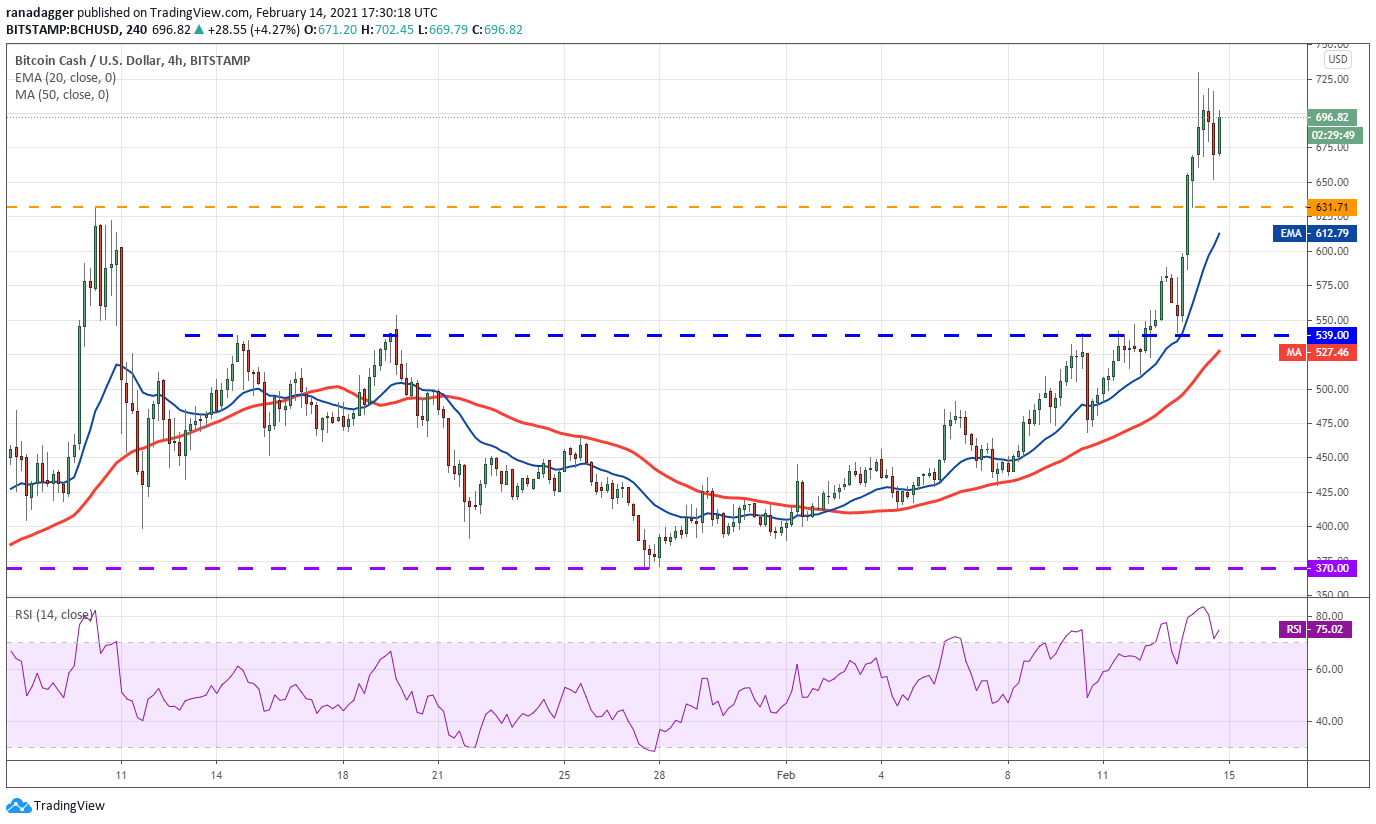
The 4-hour chart shows the bears are defending the $720 resistance and the bulls are buying on dips to $650. If the buyers can propel the price above $730.02, the uptrend could resume.
On the other hand, if the price again turns down from $720, the bears will try to pull the price down to $631.71. If this support cracks, the decline could extend to the 20-EMA and then to the 50-SMA.
EOS/USD
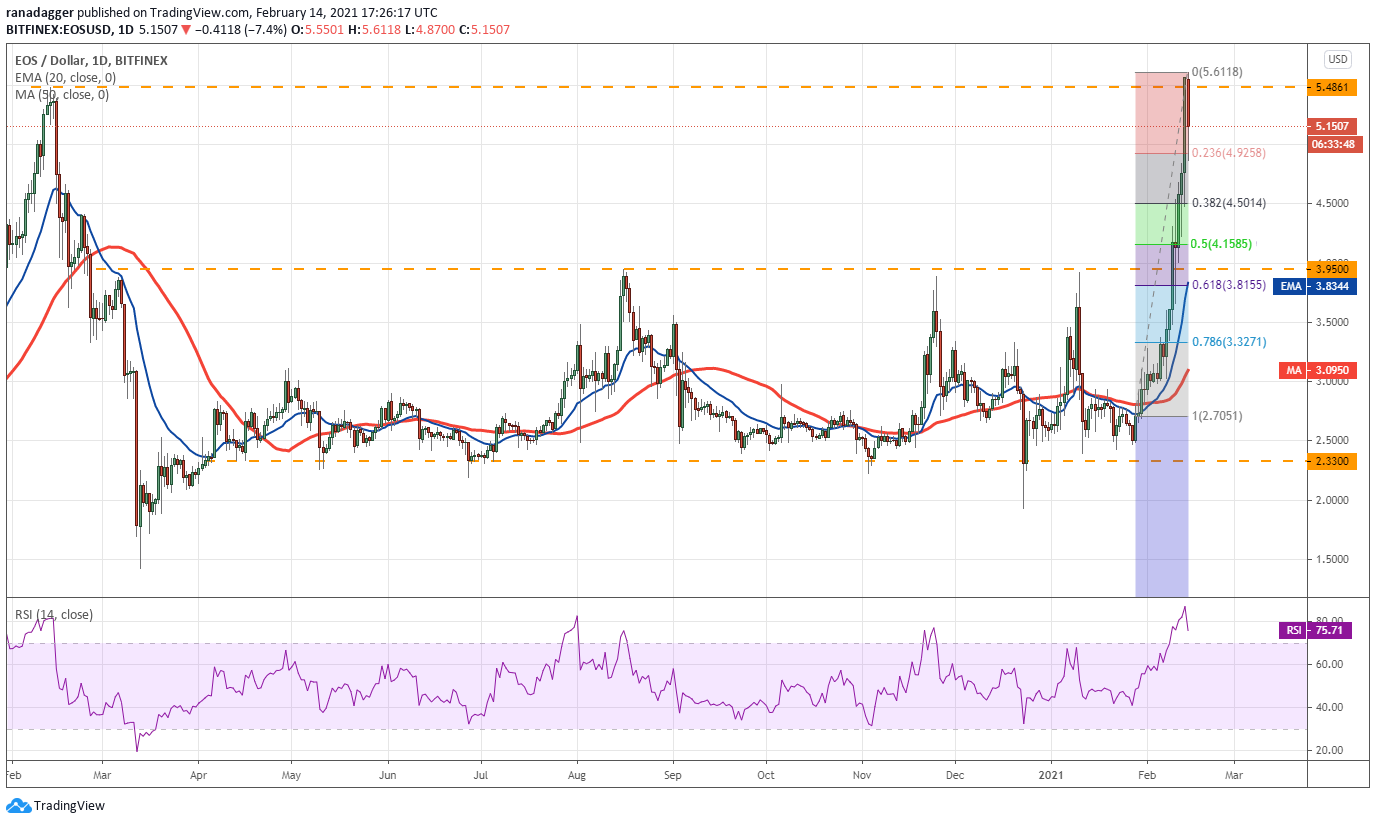
EOS broke out of the long basing formation and started a new uptrend when it soared above the $3.95 overhead resistance on Feb. 9. The altcoin picked up momentum and the bulls pushed the price above the $5.4861 resistance on Feb. 13.
 EOS/USD daily chart. Source: TradingView
However, the failure to sustain the price above $5.4861 may have attracted profit-booking from the short-term traders. This has started a correction that could extend to the 38.2% Fibonacci retracement level at $4.5014.
If the price rebounds off this level, the bulls will again try to push and sustain the price above the $5.4861 to $5.6118 overhead resistance. Contrary to this assumption, if the bears sink the price below $4.5014, the EOS/USD pair could drop to $3.95.
Such a deep correction will suggest that the momentum has weakened and the pair could then consolidate in a wide range between $3.95 and $5.6118 for a few days.
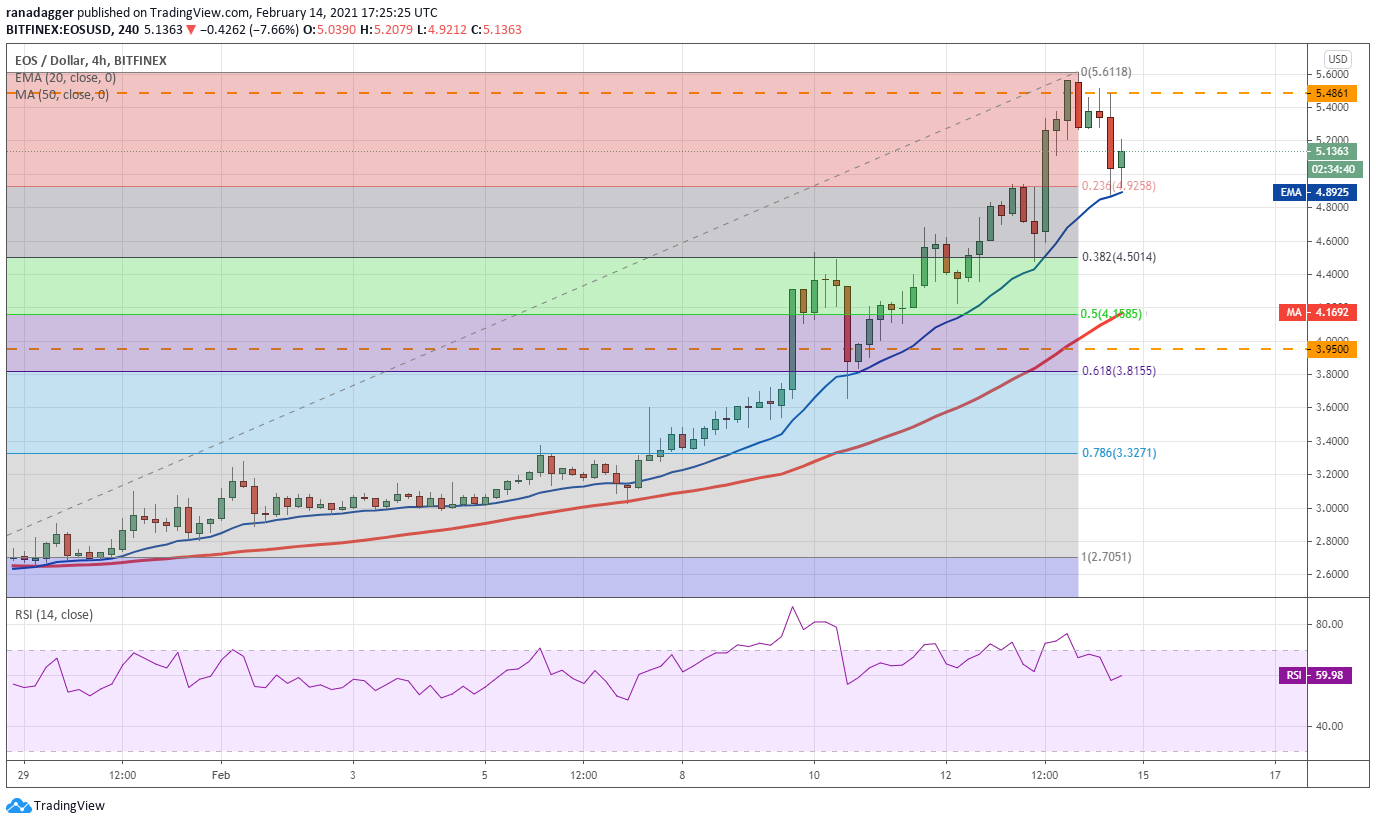 EOS/USD 4-hour chart. Source: TradingView
The 4-hour chart shows that the bulls have purchased the dip to the 20-EMA. If the pair sustains the rebound, the bulls will again try to push the price above $5.6118. If they succeed, the uptrend could resume.
The next target objective on the upside is $6 and if that level is also scaled, the uptrend could reach $7.50. On the other hand, a break below the 20-EMA could extend the correction to the 50-SMA.
XMR/USD
Monero (XMR) broke above the $190 resistance on Feb. 12 and resumed the uptrend. The 20-day EMA ($174) has turned up and the RSI has moved into overbought territory, which suggests the bulls are in command.
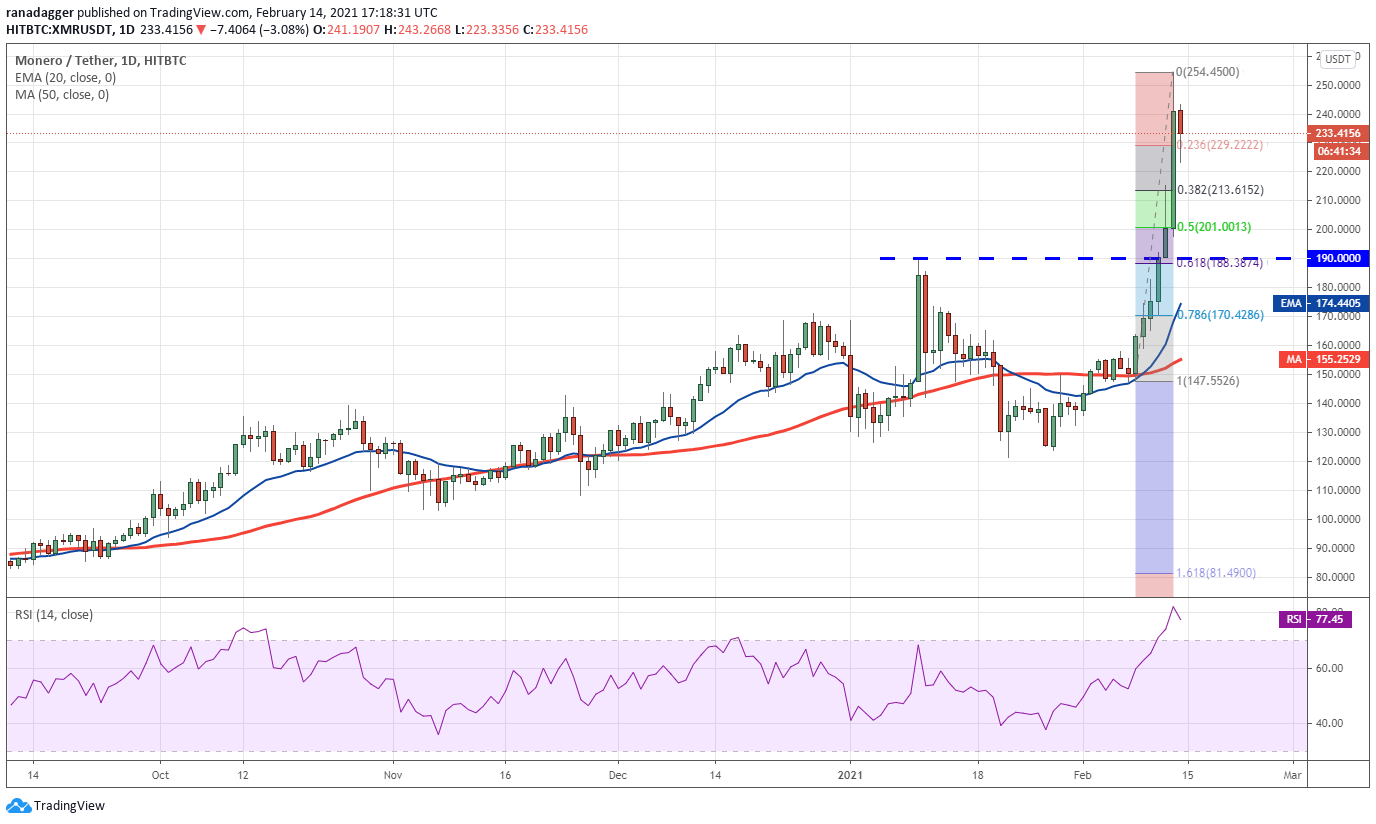 XMR/USDT daily chart. Source: TradingView
The bears are currently defending the psychological level at $250. The first support on the downside is the 38.2% Fibonacci retracement at 213.6152. If the price rebounds off this level, it will suggest that traders are viewing the dips as a buying opportunity.
A break above $254.45 will open the doors for a rally to $300 where the bears may again mount a stiff resistance.
Contrary to this assumption, if the bears sink the price below $213.6152, the correction may deepen to $190. Such a deep fall may delay the start of the next leg of the uptrend.
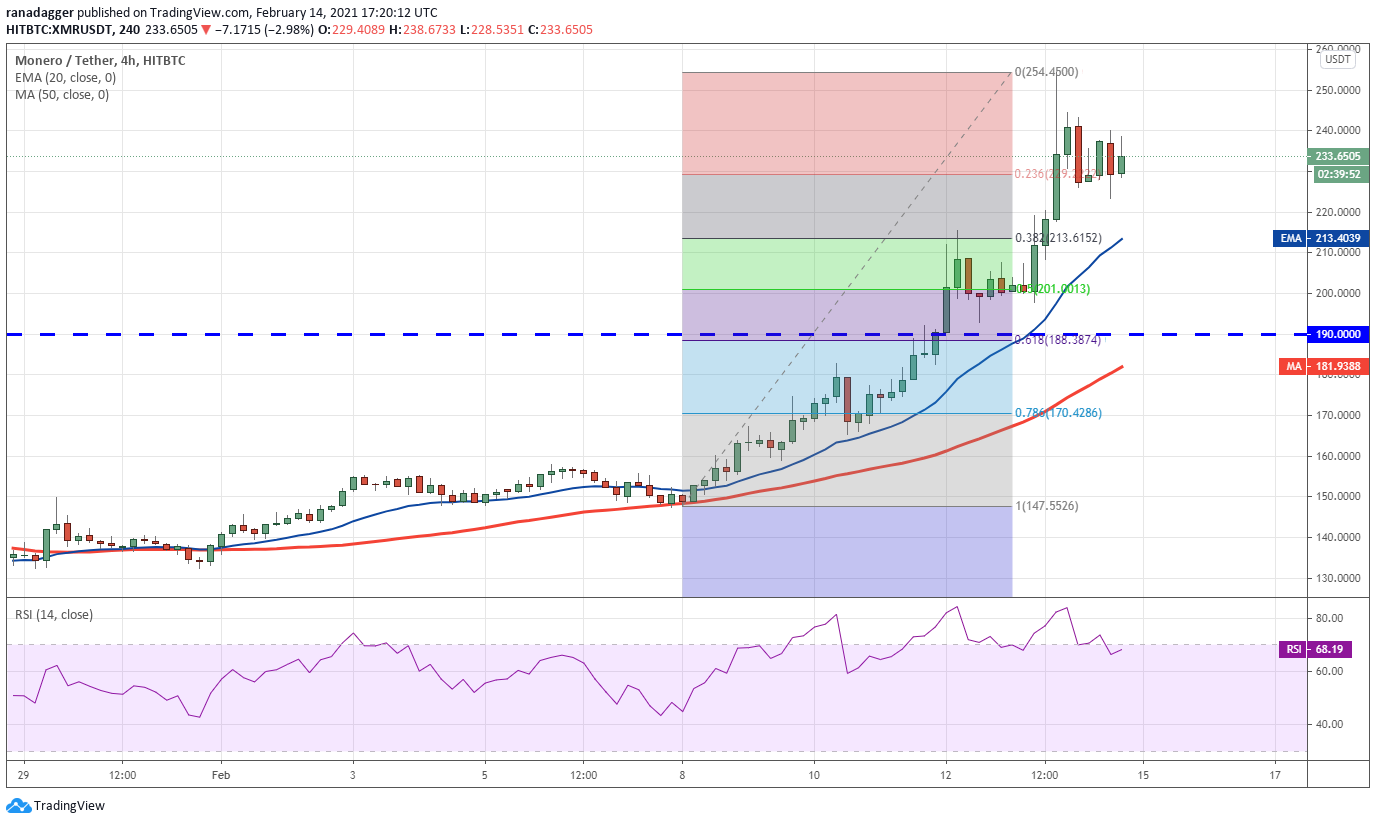 XMR/USDT 4-hour chart. Source: TradingView
The 4-hour chart shows the bears are defending the $240 to $254.45 resistance zone but the positive sign is that the bulls have not given up much ground. If the price rises from the current level or rebounds off the 20-EMA, it will signal strength.
If the bulls can push the price above the overhead resistance, a rally to $268 and then to $300 is likely. This bullish view will invalidate if the XMR/USD pair dips and closes below the 20-EMA.
XTZ/USD
Tezos (XTZ) broke above the previous all-time high at $4.4936 on Feb. 12 and has made a new high at $5.6471 today. Whenever an asset hits a new high, it indicates that bulls are in control.
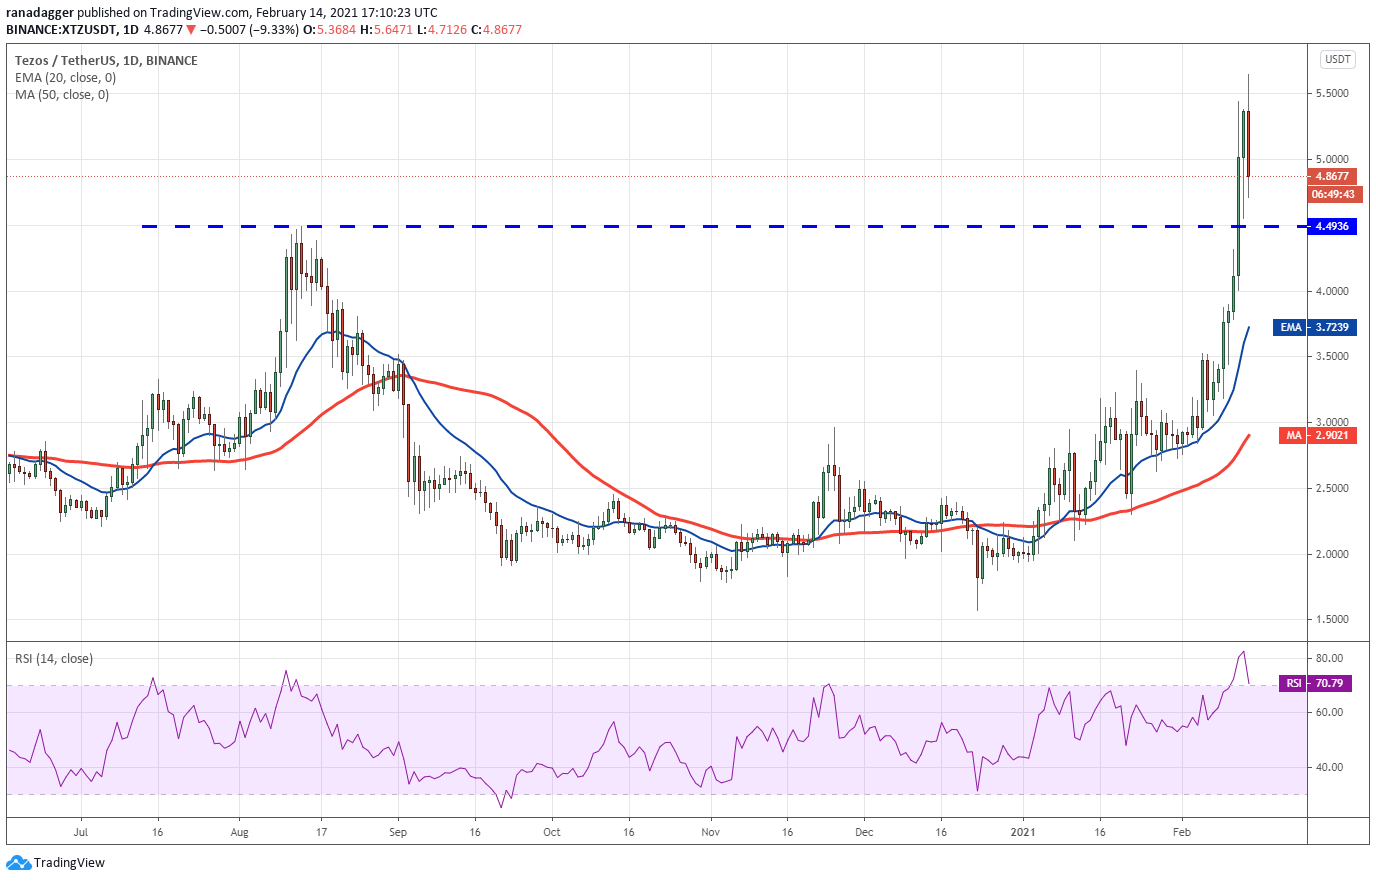 XTZ/USDT daily chart. Source: TradingView
Another thing that usually happens when a major resistance is broken is that the price turns down and retests the breakout level. In this case, the price could dip to the breakout level at $4.4936.
If the price rebounds off this level, it will suggest that traders are buying on dips and have flipped the previous resistance to support. The bulls will then attempt to resume the uptrend by pushing the price above $5.6471.
If they succeed, the XTZ/USD pair could rally to $7.1407. This bullish view will invalidate if the pair breaks and sustains below $4.4936.
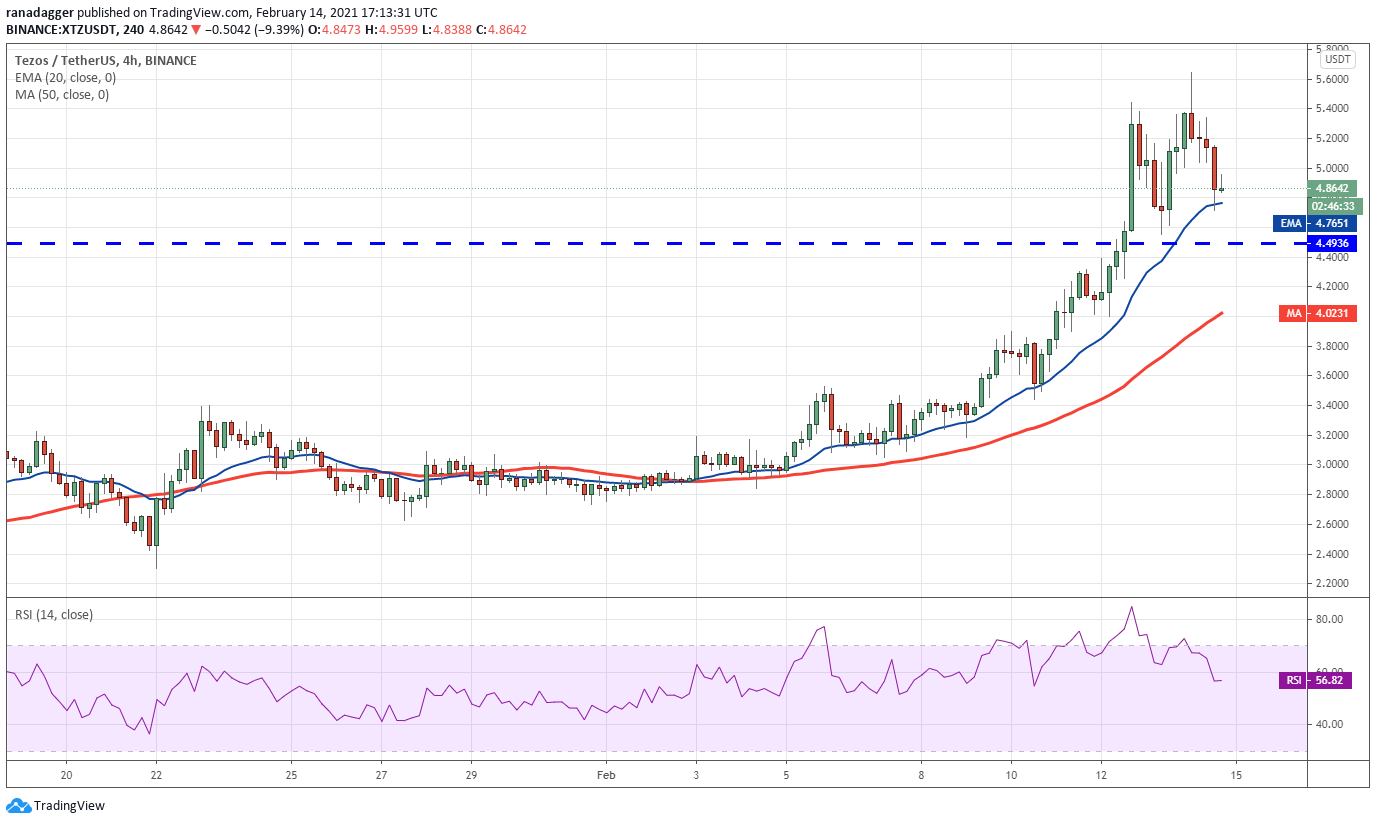 XTZ/USDT 4-hour chart. Source: TradingView
The 4-hour chart shows that the bulls could not sustain the price above $5.40, which may have attracted profit-booking from short-term traders. The bulls are currently attempting to defend the 20-EMA.
If the price rebounds off this support, it will signal strength. A break above $5.6471 may resume the up-move. On the other hand, if the price dips below the 20-EMA and the $4.4936 support, the correction could deepen to the 50-SMA.
The views and opinions expressed here are solely those of the author and do not necessarily reflect the views of Cointelegraph. Every investment and trading move involves risk, you should conduct your own research when making a decision.