Corrections in a bull phase are usually a bullish sign as they reduce the frothy excitement and allow stronger hands to enter the markets. However, the recent correction in Bitcoin (BTC) from its all-time high at $64,849.27 does not seem to have scared novice traders.
Data from DappRadar shows that decentralized exchange volumes have picked up in the last week as traders may have exited profitable Bitcoin positions to buy altcoins at their current rock bottom prices.
Another sign of interest in altcoins is the sustained high volumes in Dogecoin (DOGE), which remains the fourth most traded cryptocurrency by volume, behind Bitcoin, Ether (ETH), and XRP, according to data from CoinMarketCap.
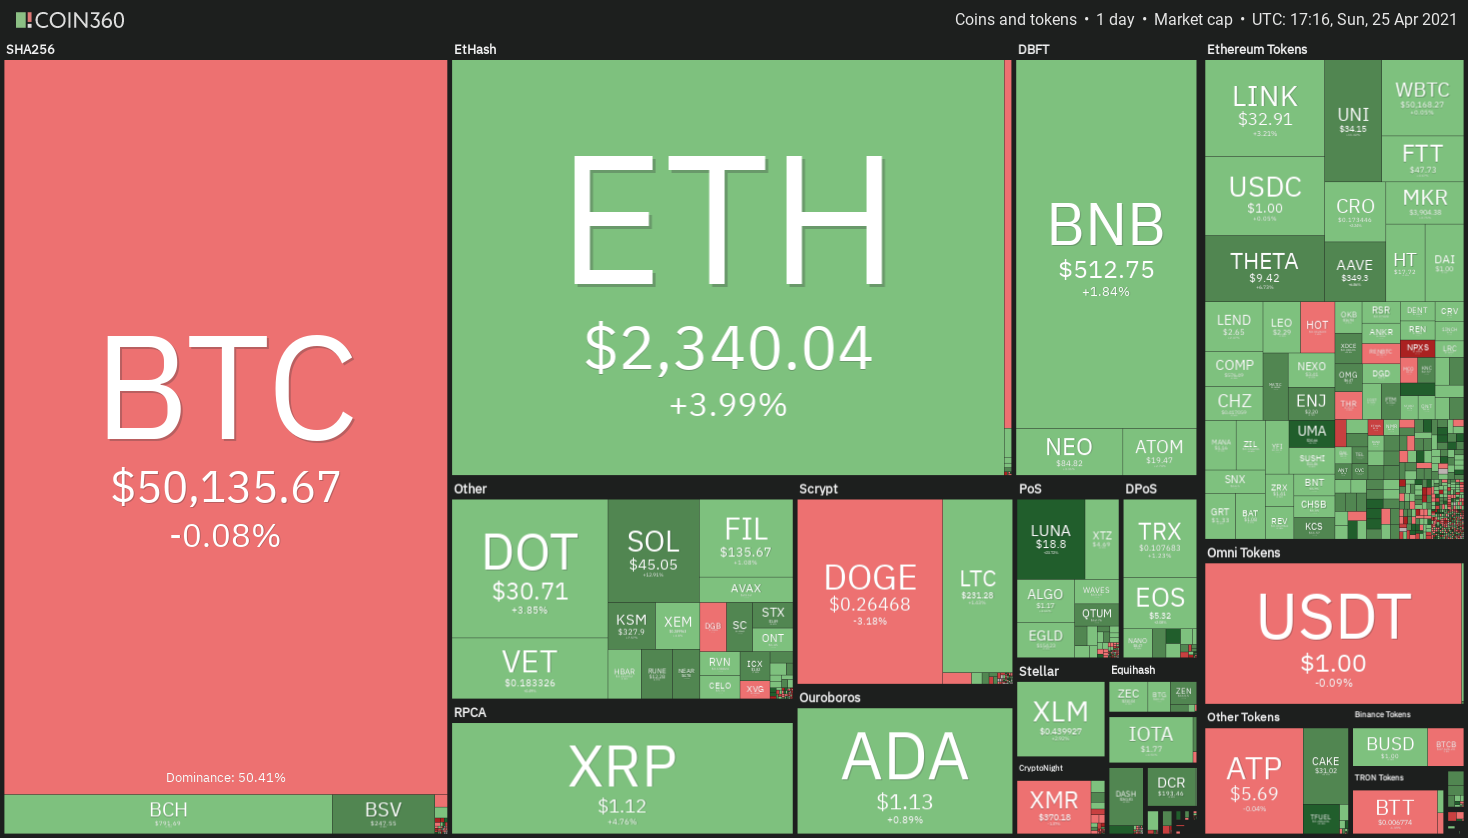 Crypto market data daily view. Source: Coin360
The recent fall in Bitcoin witnessed selling from the small-to-medium sized whales, who dumped $100,000 to $1 million worth of Bitcoin on the exchanges. However, a positive sign is that the larger-sized whales have continued to accumulate during this period.
While the long-term bullish story remains intact, the near term could see some more downside. Generally, a correction does not end until the retail crowd throws in the towel and a state of fear grips the markets.
In such an uncertain atmosphere, let’s look at the top-5 cryptocurrencies that are likely to outperform the other major cryptocurrencies in the short term.
BTC/USDT
The bulls are trying hard to push the price back above the psychological level of $50,000 but are facing stiff resistance from the bears on every minor rise. This shows that the bears are trying to hold on to their advantage and extend the decline to the next critical support at $43,006.
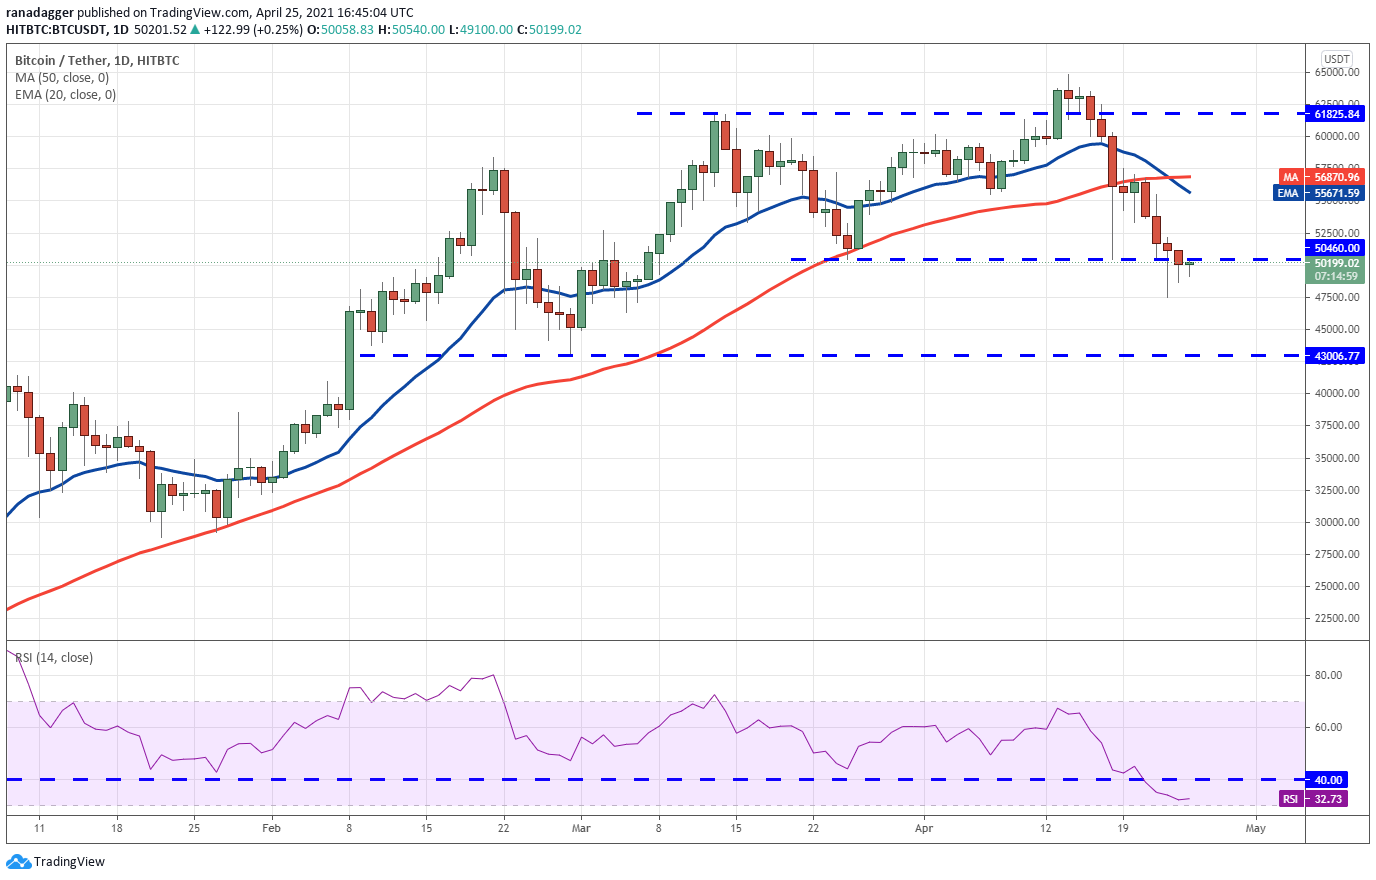 BTC/USDT daily chart. Source: TradingView
The 20-day exponential moving average ($55,671) is sloping down and the relative strength index (RSI) is close to the oversold territory, suggesting the bears have the upper hand.
The BTC/USDT pair had formed an inside day candlestick pattern on April 24 and today, indicating indecision among the bulls and the bears. If the uncertainty resolves to the downside, the selling could intensify, opening the gates for a decline to $43,006.
On the other hand, if the bulls can push the price above $52,129, the pair could witness a relief rally that is likely to face resistance at the 20-day EMA. If the price turns down from this resistance, the possibility of a break below $47.459 increases.
This negative view will invalidate if the bulls push and sustain the price above the 50-day simple moving average ($56,870).
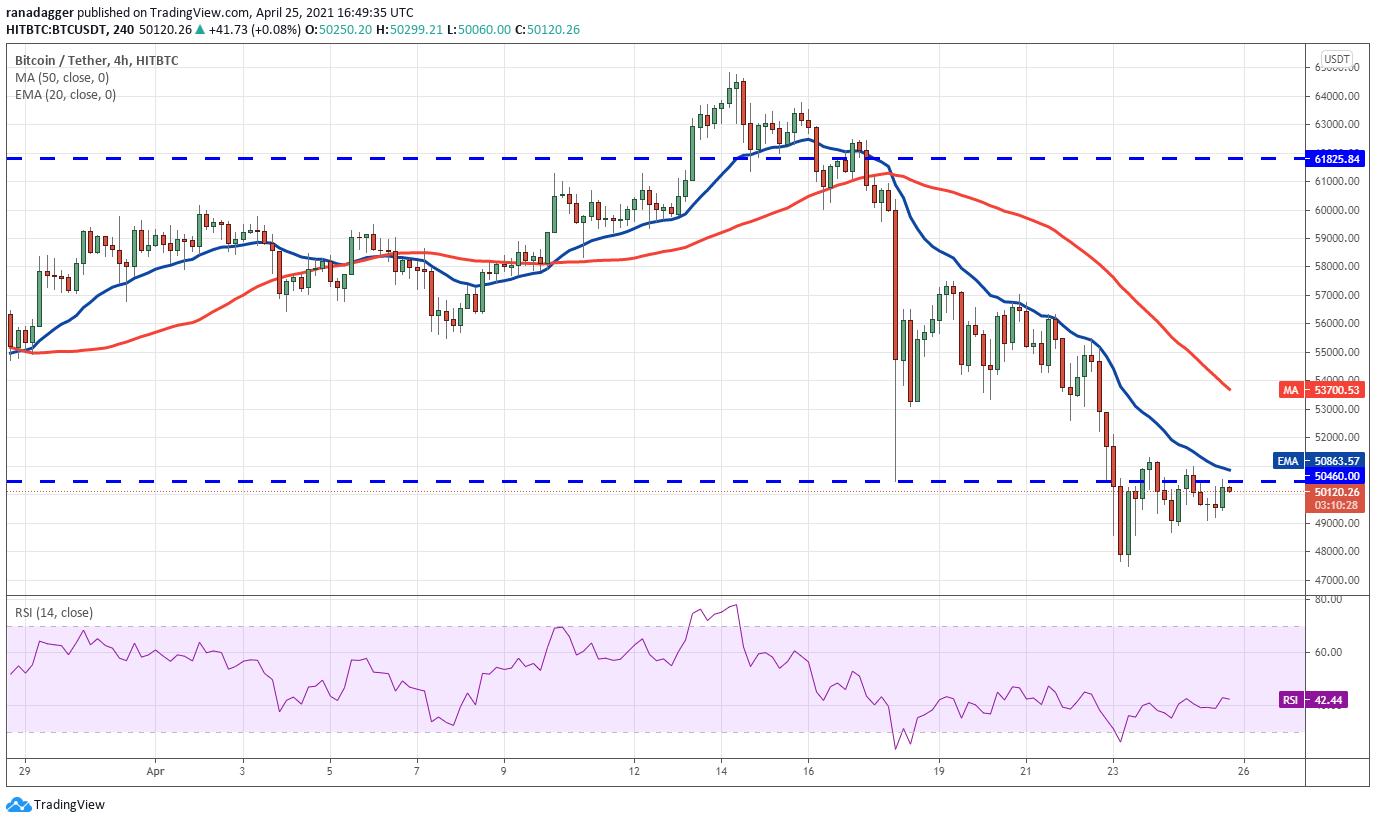 BTC/USDT 4-hour chart. Source: TradingView
The 4-hour chart shows the bears have been selling on relief rallies to the 20-EMA. With both moving averages sloping down and the RSI trading in the negative zone, the advantage is with the bears.
If the bears sink the price below $48,664.67, the pair could drop to $47,459. A break below this support could resume the down move.
Conversely, a break above the 20-EMA will be the first sign that the selling has dried up and the bulls have a chance to extend the relief rally to the 50-SMA.
ETH/USDT
The bulls have once again defended the 20-day EMA ($2,235), indicating the trend remains strong and the buyers are accumulating on dips. Ether will now try to rally to the $2,545 to $2,645 overhead resistance zone.
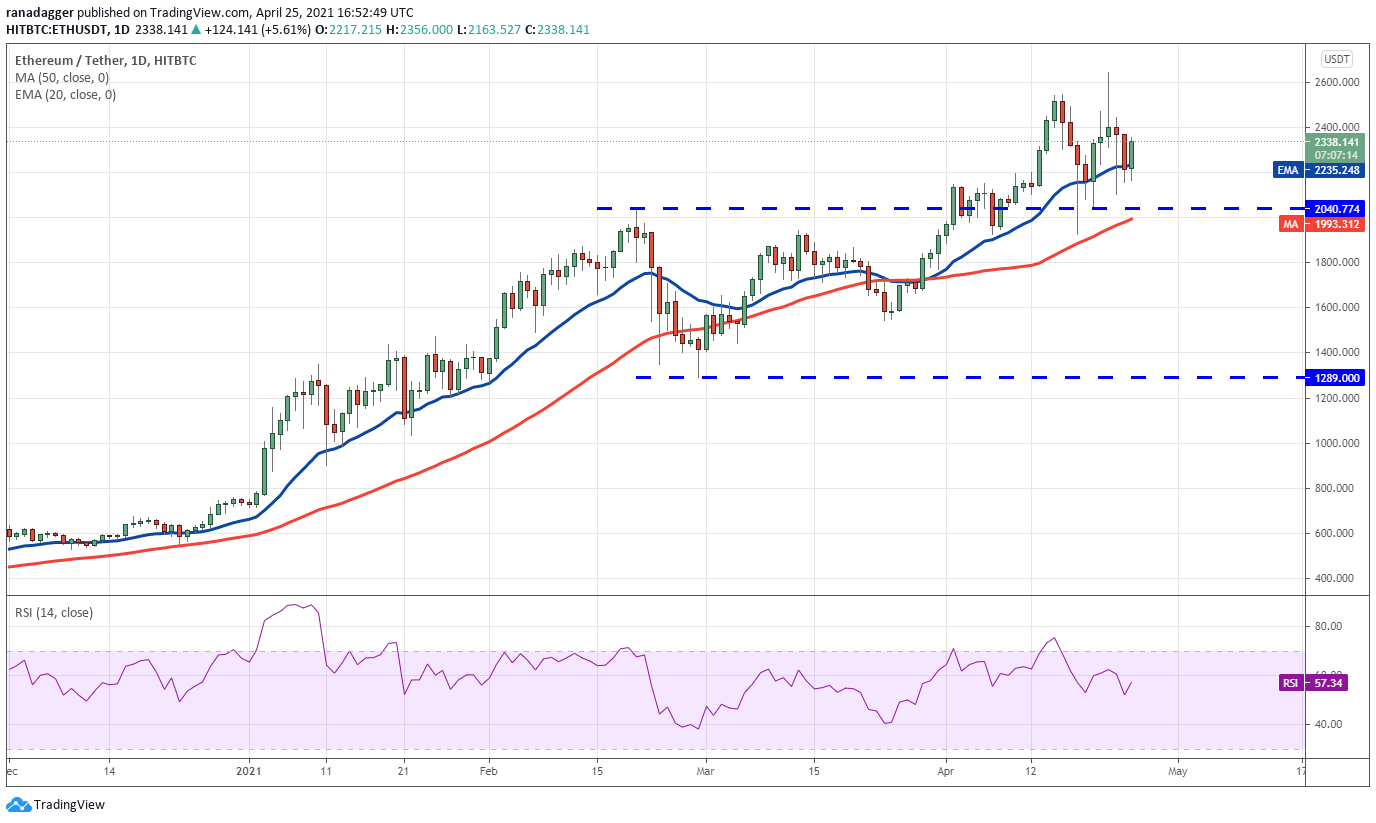 ETH/USDT daily chart. Source: TradingView
A breakout of the overhead zone could signal the start of the next leg of the uptrend that may extend to $2,745 and then $3,000. The gradually rising moving averages and the RSI above 57 suggest the path of least resistance is to the upside.
Contrary to this assumption, if the price turns down from the overhead resistance, the bears will again try to sink the ETH/USDT pair below the moving averages. If they succeed, the pair may start a deeper correction to $1,542.
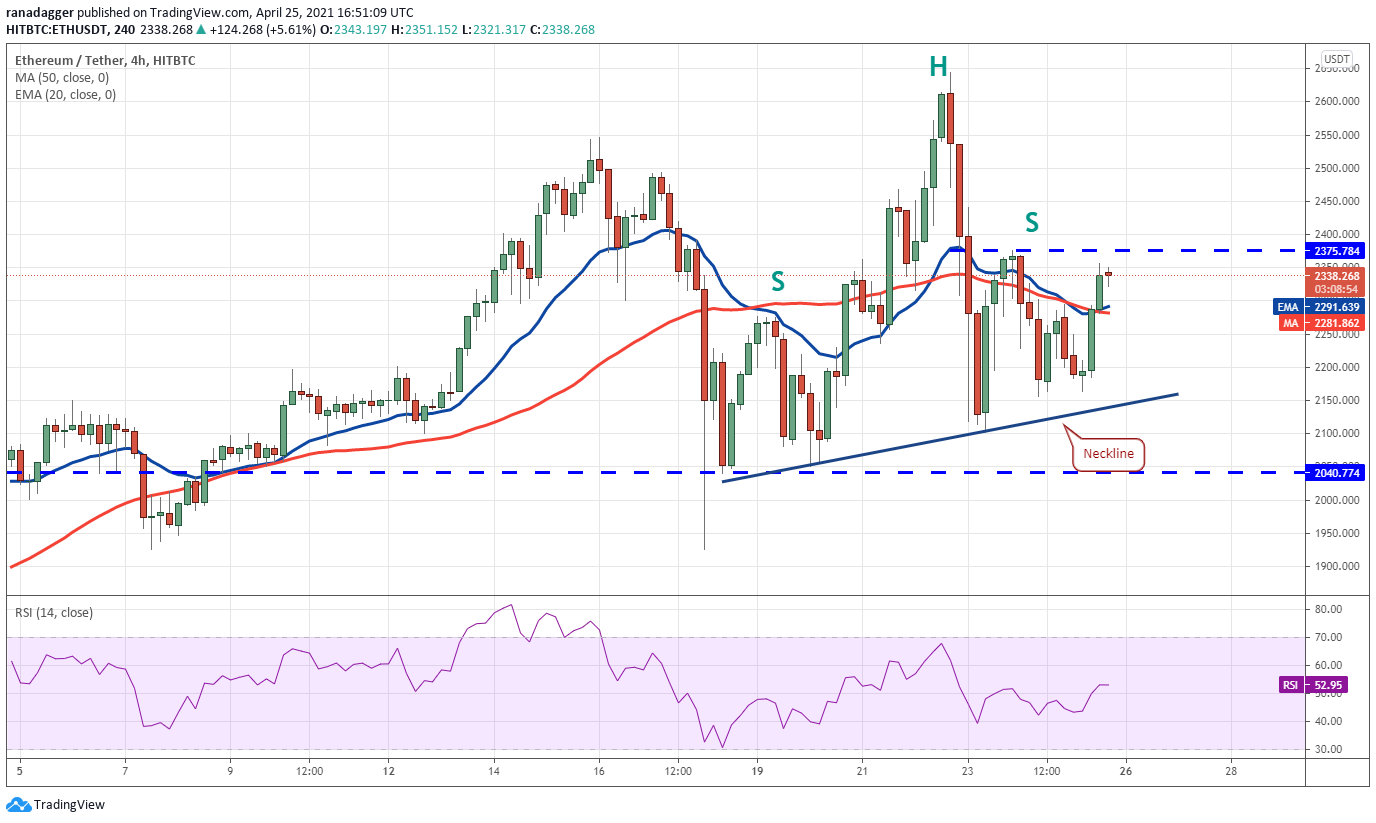 ETH/USDT 4-hour chart. Source: TradingView
The 4-hour chart shows the pair has formed a head and shoulders pattern, which will complete on a break and close below the neckline. Such a move could pull the price down to the pattern target at $1,600.
On the other hand, if the bulls can push the price above $2,375, the pair could retest the all-time high at $2,645. Such a move will invalidate the pattern and the pair is likely to pick up momentum on a break above $2,645.
BNB/USDT
Binance Coin (BNB) is currently consolidating in an uptrend. The bulls are buying the dips to the $480 support while the bears are defending the $600 to $638.57 overhead resistance zone. A range-bound action after a strong uptrend shows that traders are not hurrying to book profits.
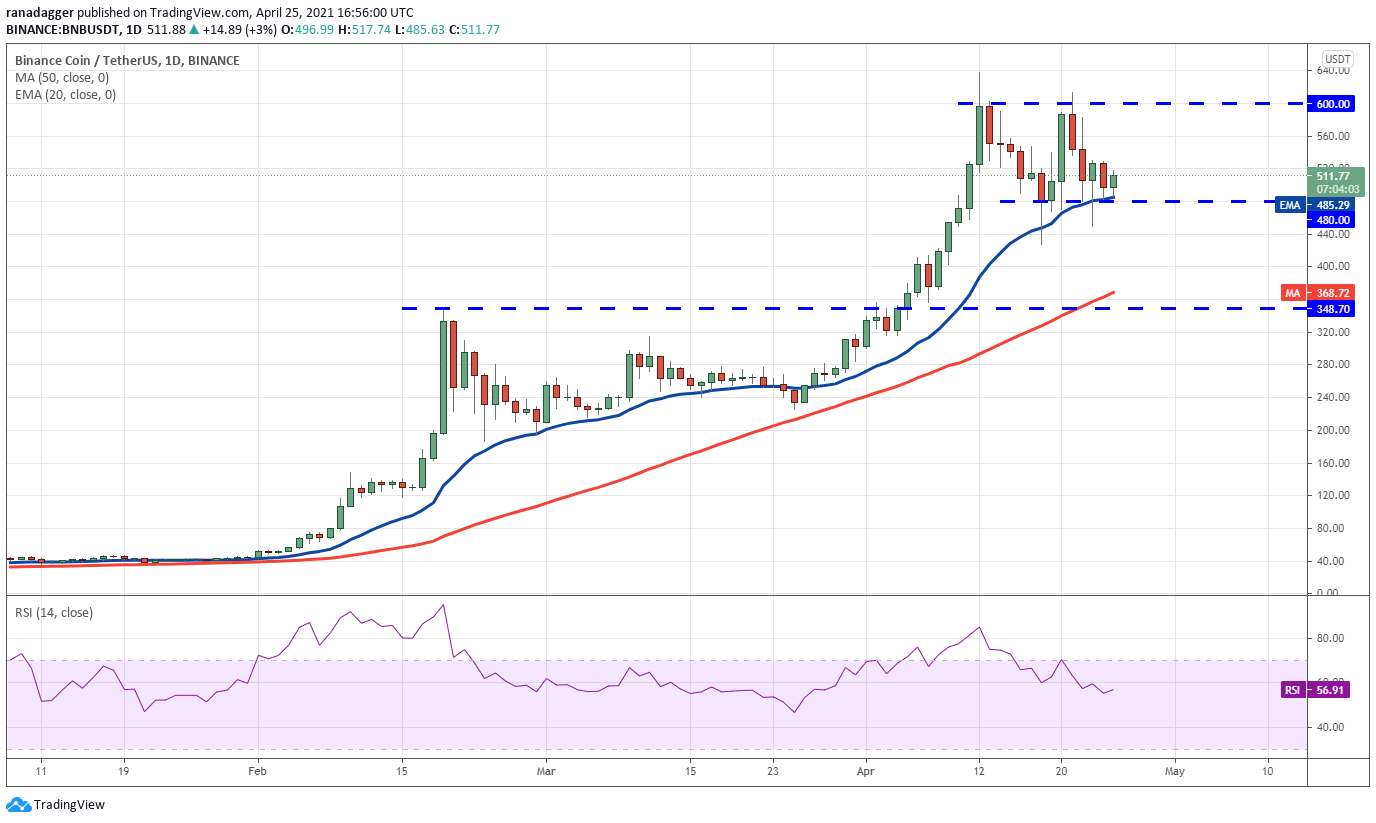 BNB/USDT daily chart. Source: TradingView
Both moving averages are sloping up and the RSI above 56 suggests that the bulls have the upper hand. If the buyers can push the price above $530, the BNB/USDT pair could start its journey to the resistance of the range at $600. The bears are again likely to mount a stiff resistance between $600 and $638.57.
If the price turns down from this zone, the range-bound action may continue for a few more days. On the contrary, if the bulls push the price above $638.57, the pair could start its journey to $720 and then $832.
This positive view will invalidate if the bears sink and sustain the price below $480. If that happens, the selling may intensify and the pair may drop to the 50-day SMA ($368).
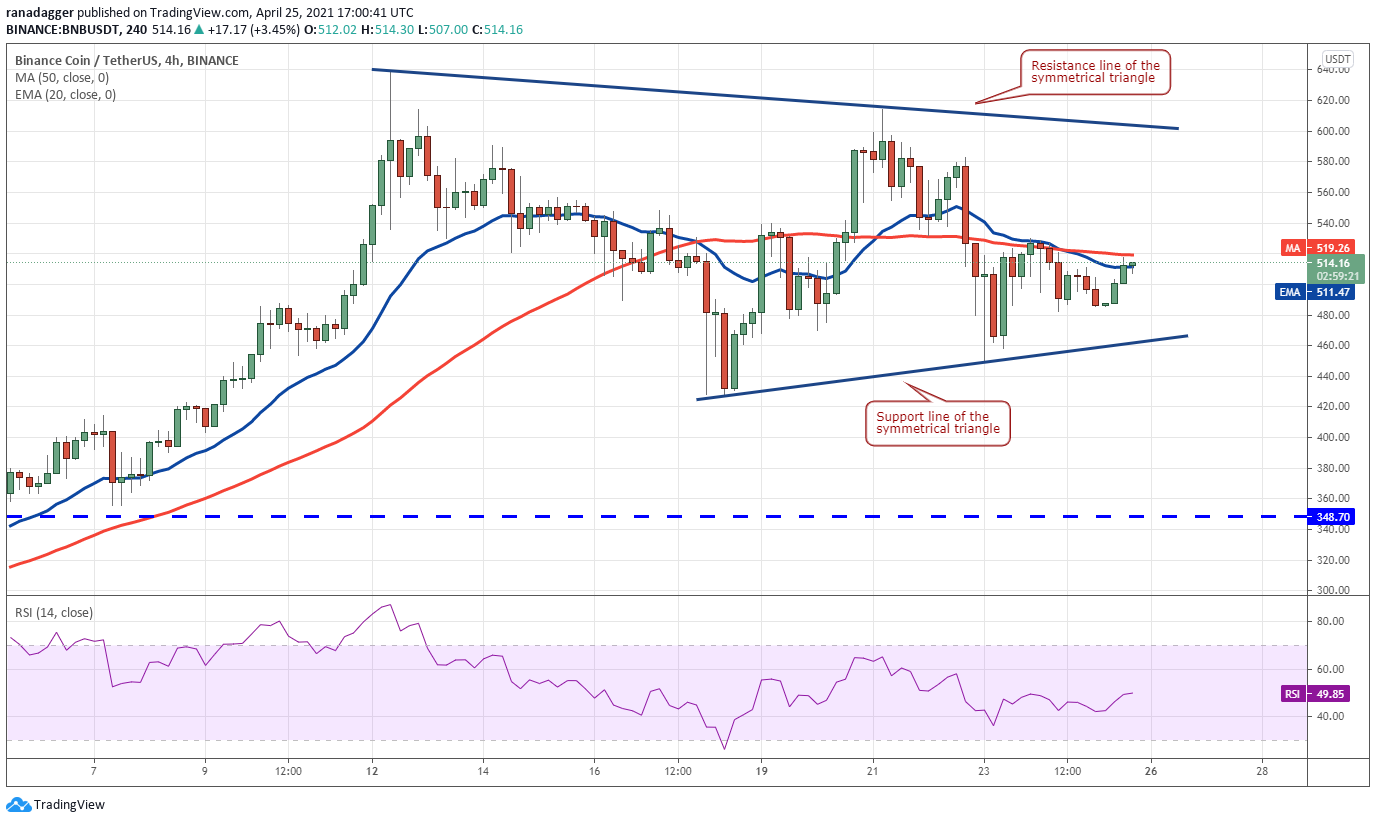 BNB/USDT 4-hour chart. Source: TradingView
The 4-hour chart shows the price is stuck inside a large symmetrical triangle. Although the price rebounded off the support line of the triangle, the bears are attempting to stall the relief rally at the moving averages.
If that happens and the price turns down from the current level, the bears will sense an opportunity and try to sink the price below the triangle. If they succeed, the pair could start a deeper correction to $348.
Alternatively, if the bulls push the price above the moving averages, the pair could rise to the resistance line of the triangle. A breakout of the triangle may signal the resumption of the uptrend.
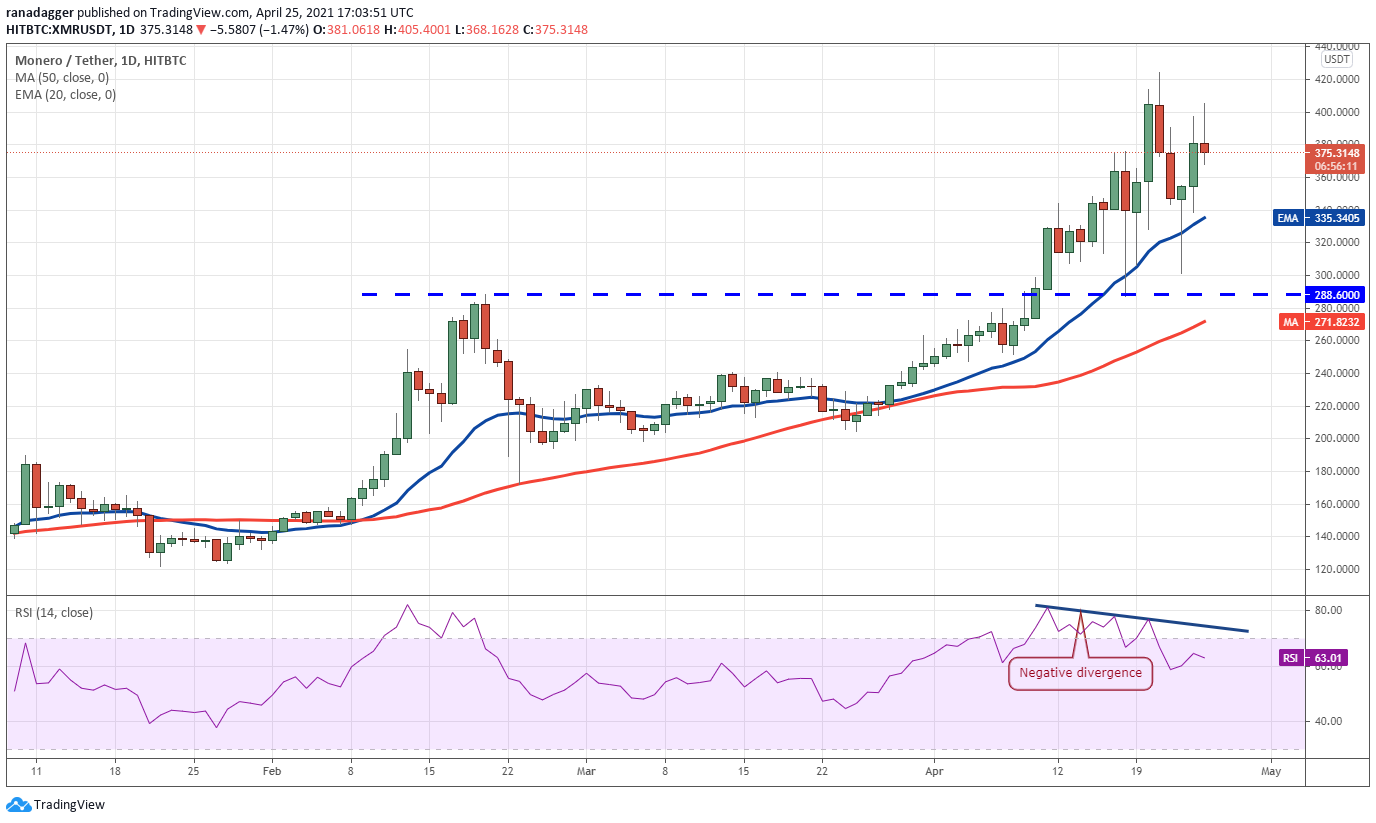
XMR/USDT
Monero (XMR) is in a strong uptrend and repeated attempts by the bears to start a correction have failed as the bulls have aggressively bought the dips close to the $288.60 support.
 XMR/USDT daily chart. Source: TradingView
The bulls have successfully defended the 20-day EMA ($335) and both moving averages are sloping up, suggesting the buyers have the upper hand. However, the RSI is showing the first signs of a negative divergence, indicating the momentum may be weakening.
If the price turns down from the current level and breaks below the 20-day EMA, it will suggest the possible start of a correction to $288.60. On the other hand, if the bulls push the price above $424.55, the XMR/USDT pair could rally to $498.
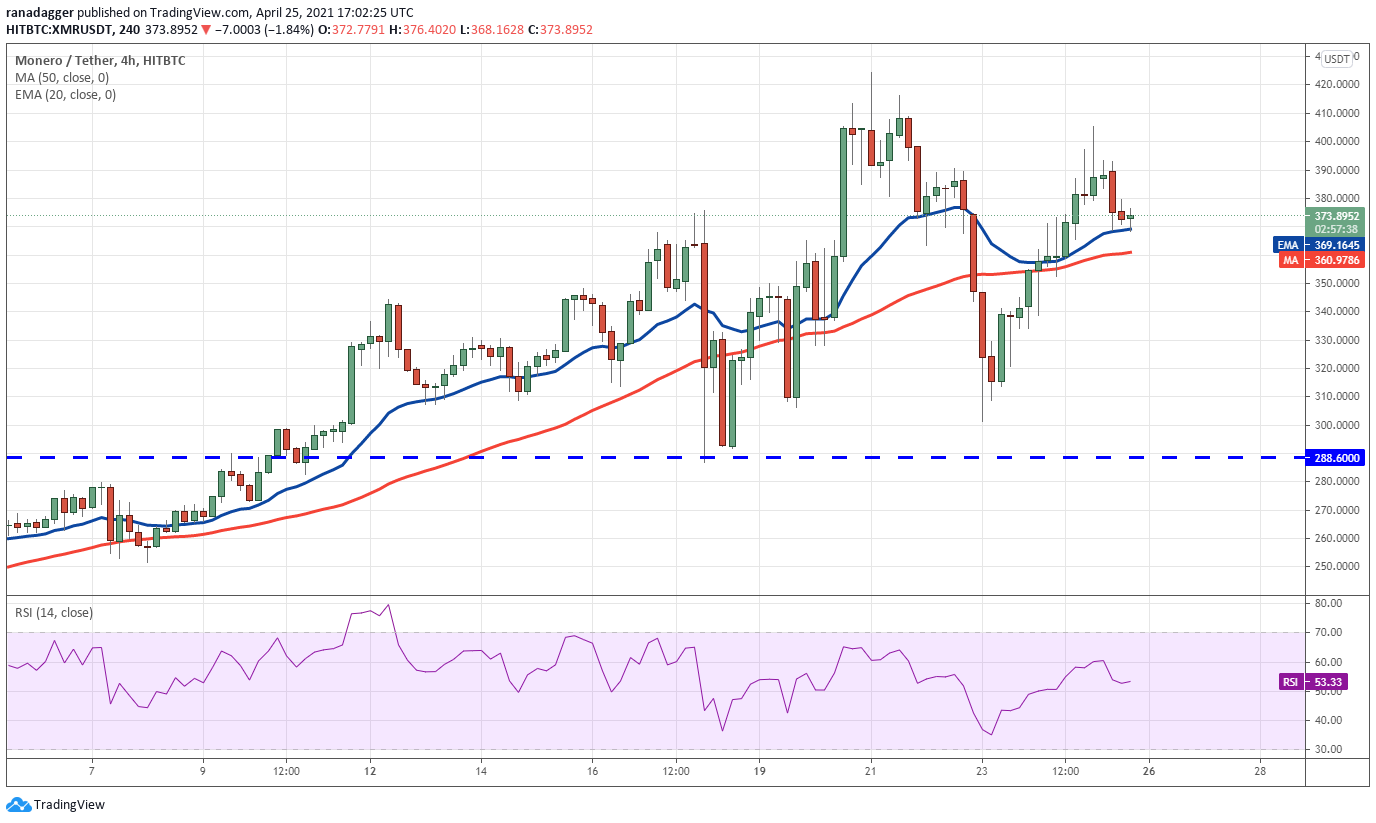 XMR/USDT 4-hour chart. Source: TradingView
The 4-hour chart shows that the volatility has picked up in the past few days. The bears have repeatedly broken the 50-SMA but the bulls have aggressively purchased the dip and pushed the price back above the 20-EMA.
If the pair rebounds off the current level and rises above $405.40, a retest of $424.55 is possible. A breakout of this resistance could start the next leg of the uptrend. Conversely, if the bears sink the price below the moving averages, a drop to $288.60 is likely.
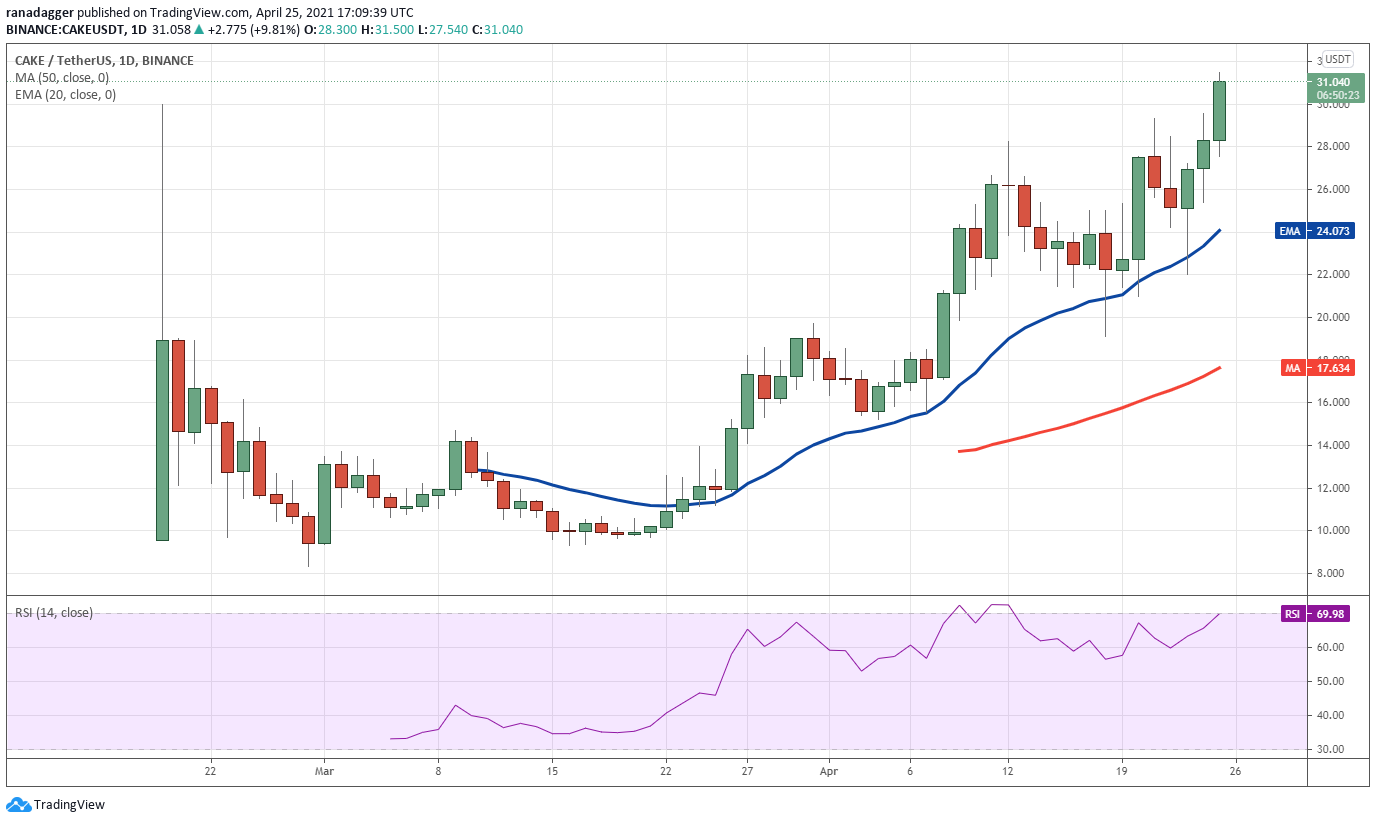
CAKE/USDT
PancakeSwap (CAKE) had been facing stiff resistance near the $28 level for the past few days. The bears tried to sink the price below the 20-day EMA ($24) on April 23 but the bulls aggressively purchased the dip, suggesting the sentiment remains positive.
 CAKE/USDT daily chart. Source: TradingView
Momentum picked up in the past two days and the CAKE/USDT pair has broken out to a new all-time high today. The upsloping moving averages and the RSI near the overbought zone suggest the path of least resistance is to the upside.
If the bulls sustain the price above $30, the pair could rally to $34.50. This bullish view will invalidate if the bears sink and sustain the price below the 20-day EMA. Such a move will be a significant event as the price has not sustained below the 20-day EMA since March 24.
VORTECS™ data from Cointelegraph Markets Pro began to detect a bullish outlook for CAKE on April 23, just as the rally was getting started.
The VORTECS™ Score, exclusive to Cointelegraph, is an algorithmic comparison of historic and current market conditions derived from a combination of data points including market sentiment, trading volume, recent price movements and Twitter activity.
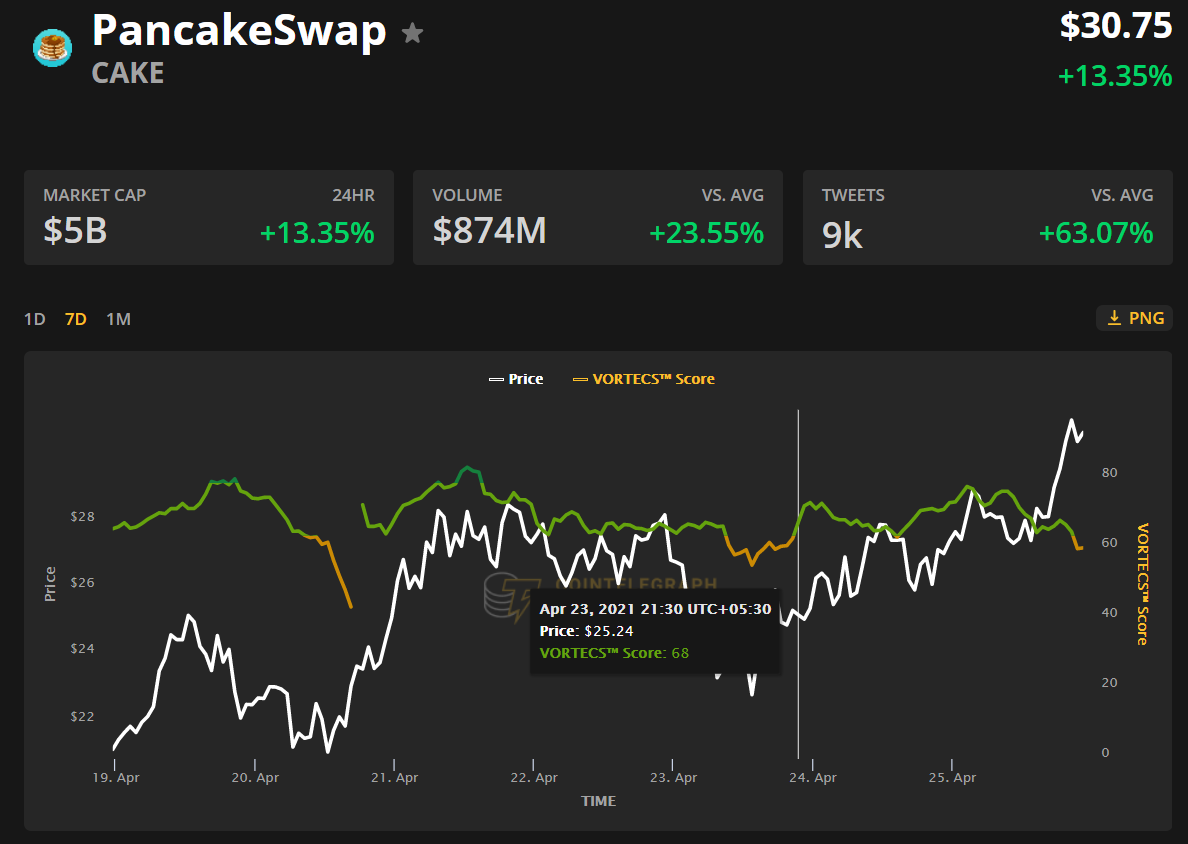 VORTECS™ Score (green) vs. CAKE price. Source: Cointelegraph Markets Pro
As seen in the chart above, the VORTECS™ Score for CAKE flipped green on April 23 when the price was $25.24.
From there, the VORTECS™ Score consistently remained in the green and CAKE rallied to a high at $31.12 on April 25, recording a gain of 23% in about two days.
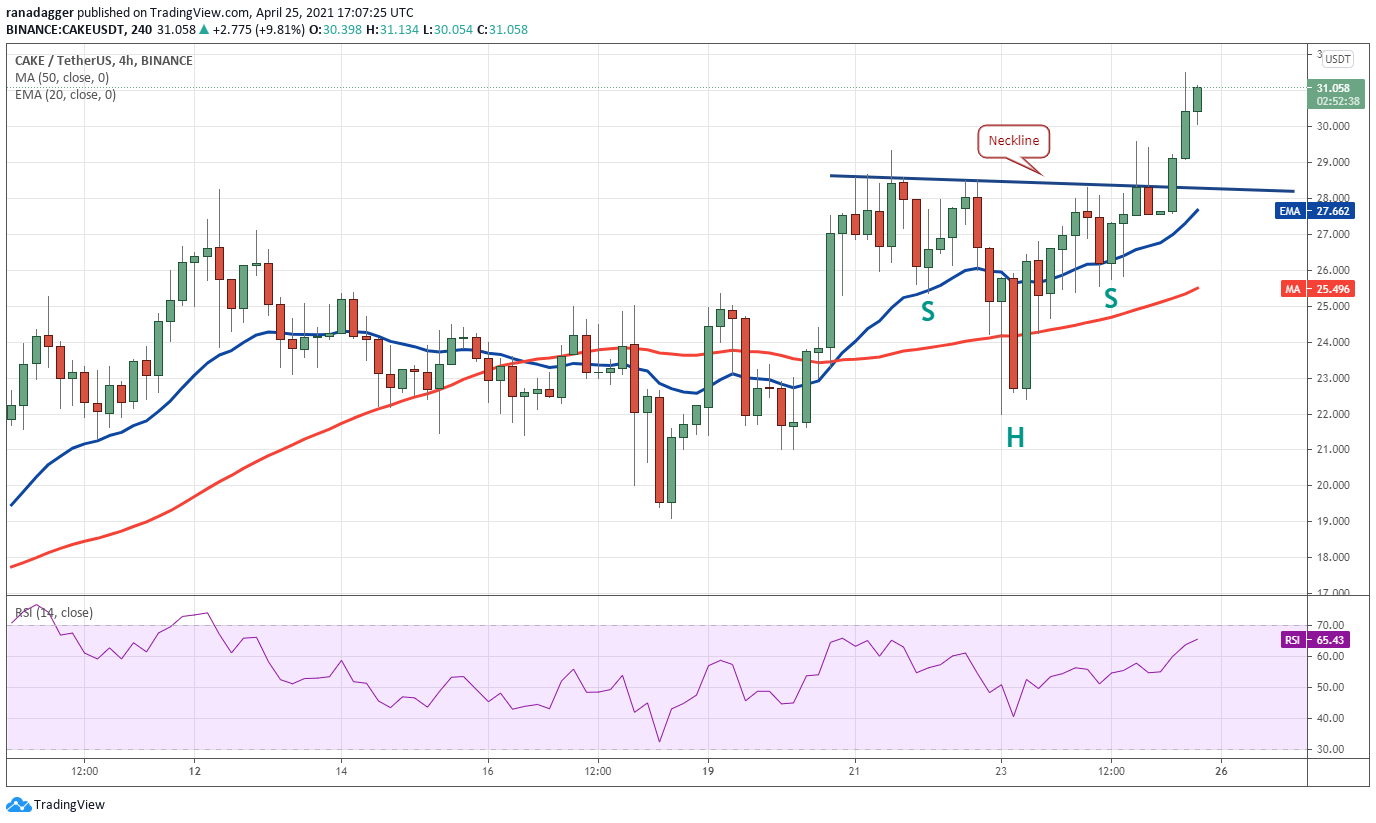 CAKE/USDT 4-hour chart. Source: TradingView
The 4-hour chart shows the formation of an inverse head and shoulders pattern. This bullish setup has a pattern target at $34.70. The 20-EMA has started to turn up and the RSI has risen above 65, indicating the bulls have the upper hand.
In case of a correction, the bulls will try to flip the neckline of the pattern into support. If they do that, the uptrend could resume. Conversely, a break below $27.50 may tilt the advantage in favor of the bears, signaling selling at higher levels
The views and opinions expressed here are solely those of the author and do not necessarily reflect the views of Cointelegraph. Every investment and trading move involves risk, you should conduct your own research when making a decision.