On Crypto Twitter, a surge of attention directed at a coin often comes in response to dramatic price action. Quite naturally, rallying assets attract the attention of traders and take over Twitter conversations, which can also create positive feedback loops that further prop up the momentum.
This is exactly what happened with some of the coins that saw a greater increase in average daily tweet volume this month, compared with the last. KuCoin Shares (KCS), which went up from $7.40 on July 4 to $14.20 on July 14, generated a staggering increase in average tweet volume, totaling more than 1,100% month-to-month.
Another big winner in terms of price, Axie Infinity (AXS), added 456% in tweet volume over the same period. In both cases, tweets mirrored the rallies’ dynamics, with the tweet volume curve closely following the price chart.
In other cases, however, the relationship can be reversed. Sometimes, the Twitter crowd picks up the news or emerging narratives that the wider market has yet to absorb, producing tweet volume spikes that come before price increases. Is there a way for traders to spot these dynamics early enough to gain an edge over the rest of the pack?
Data intelligence for early birds
Tweet volume is one of several metrics used to calculate the VORTECS™ score, an algorithmic indicator that compares complex patterns of market and social activity of an individual digital asset to years’ worth of historical data.
Exclusively available to Cointelegraph Markets Pro (CTMP) subscribers, the algorithm assesses parameters such as the market outlook, price movement, social sentiment and trading activity to generate a score that shows how suitable conditions of the observed combinations are for any coin at any given time.
On top of that, there is a dedicated space on the Markets Pro dashboard featuring assets that see abnormal tweet volume in real-time. Once they are alerted that something is brewing around a coin on Twitter, traders can be incentivized to take a closer look at the asset and make a judgment as to whether its price is likely to go up soon.
Here are three examples from the last thirty days where Twitter activity foreshadowed price action.
Crypto.com Coin
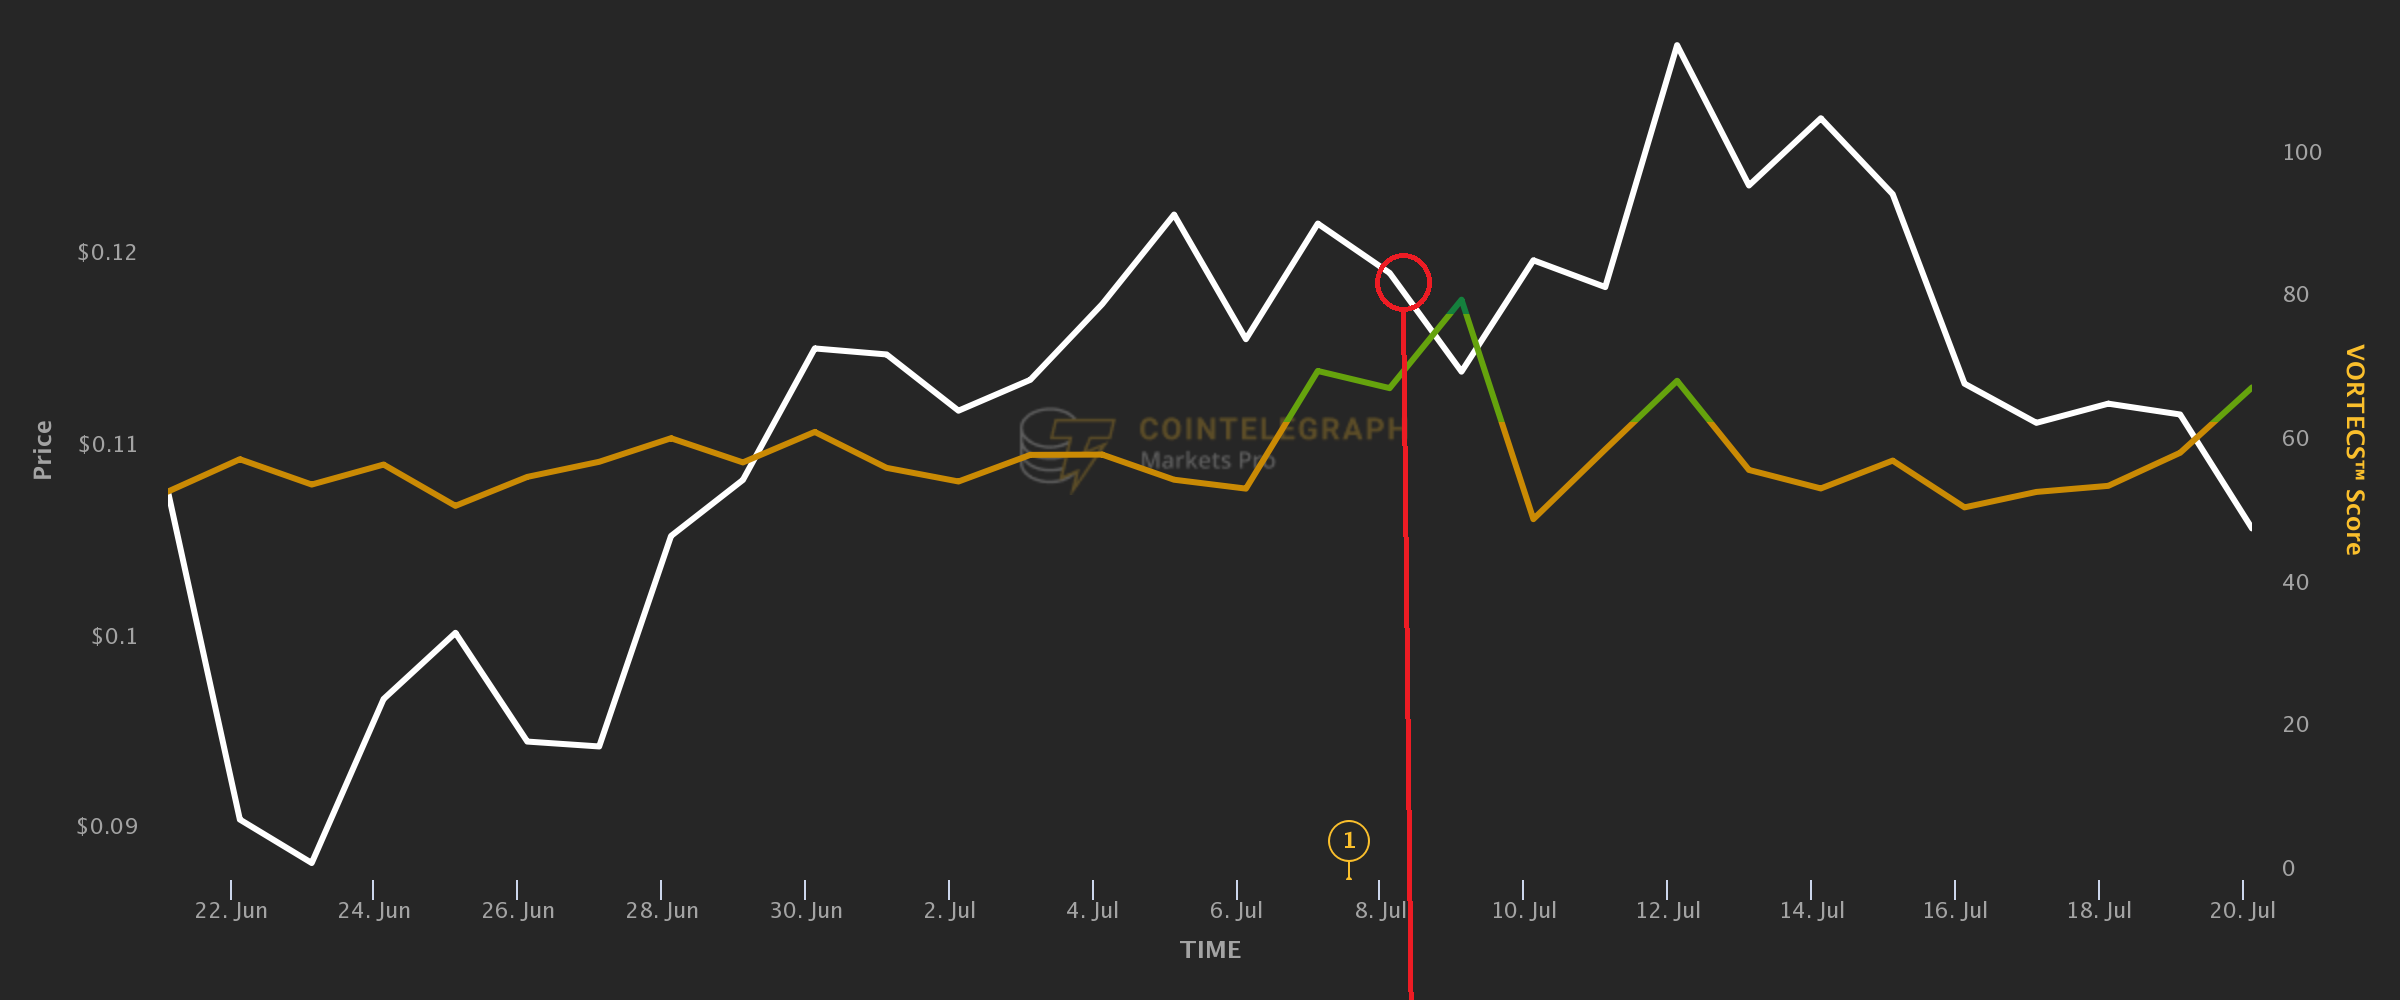
 CRO’s Price vs VORTECS™ chart. Source: Cointelegraph Markets Pro
In the case of Crypto.com Coin (CRO), the source of Twitter users’ excitement is crystal clear: A few hours before the coin flashed on Markets Pro’s Unusual Twitter Volume box (red circle in the chart), it emerged that CRO became the first digital asset platform to partner with the Ultimate Fighting Championship, or UFC. The announcement was also delivered to Markets Pro users seconds after the original source published it, thanks to the platform’s instantaneous NewsQuakes™ functionality.
Unsurprisingly, the big news triggered a sprawling Twitter conversation. If traders had not been convinced by NewsQuake™ and coin’s rising VORTECS™ score, the skyrocketing tweet volume could be the final argument in favor of opening a CRO position. The coin had been valued at $0.113 when tweet volume peaked on July 8, and it kept climbing in the next four days, eventually hitting $0.132 before the price began to decline.
Quantstamp
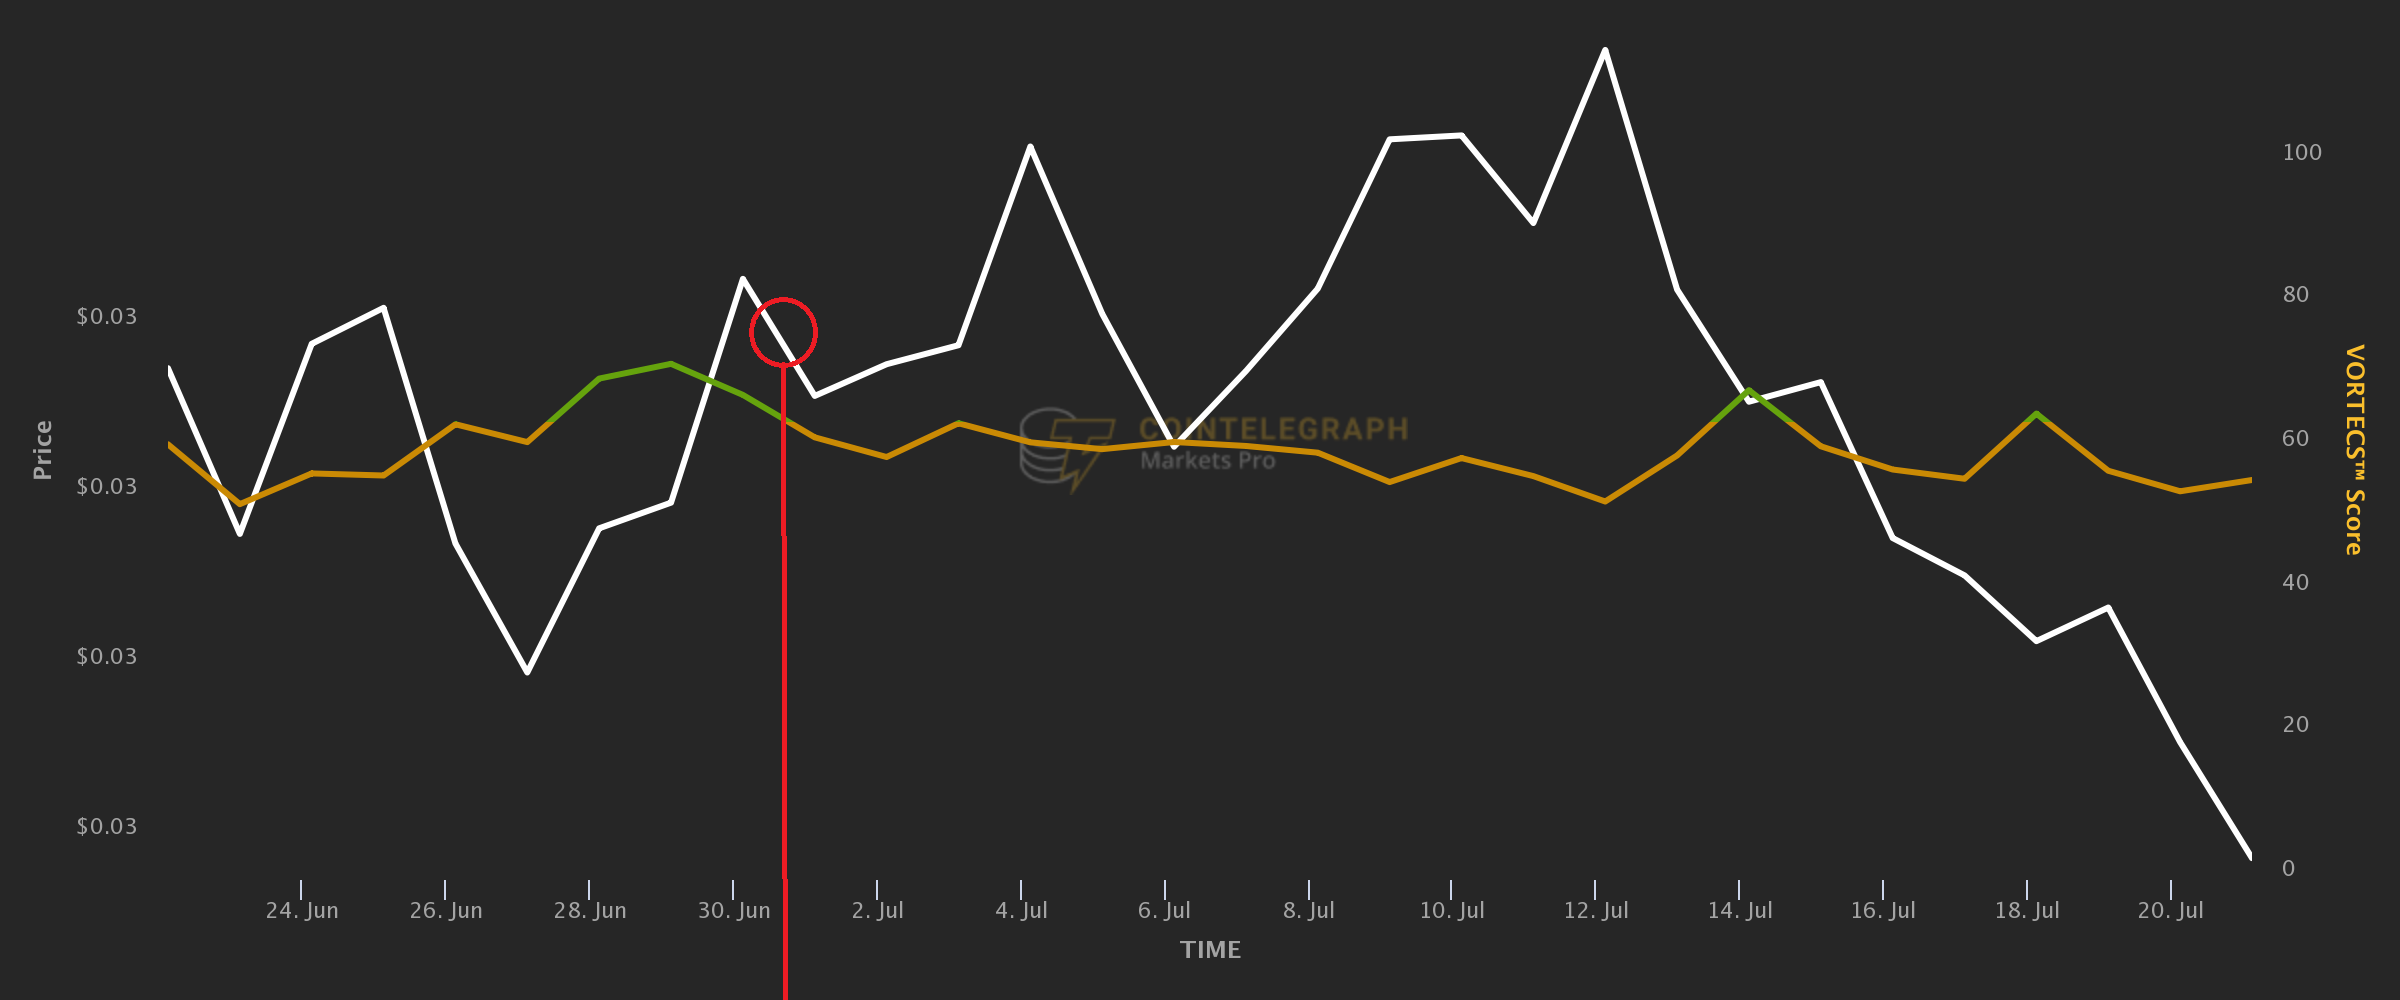
 QSP’s Price vs VORTECS™ chart. Source: Cointelegraph Markets Pro
Establishing what had triggered the surge of tweets referencing Quantstamp (QSP) around June 1 is less straightforward. One potential reason could be the launch of oneFIL, a stablecoin for the Filecoin community, around that time.
The protocol behind oneFIL is audited by Quantstamp. While QSP generates just a handful of Twitter mentions per day, on July 1 it got over 150 tweets, immediately putting it on the Markets Pro radar (red circle in the graph). While the peak tweet volume corresponded to the QSP price of $0.030, the coin pulled off a strong performance in the following days, reaching $0.034 on July 4, continuing to push further.
Flow Dapper Labs
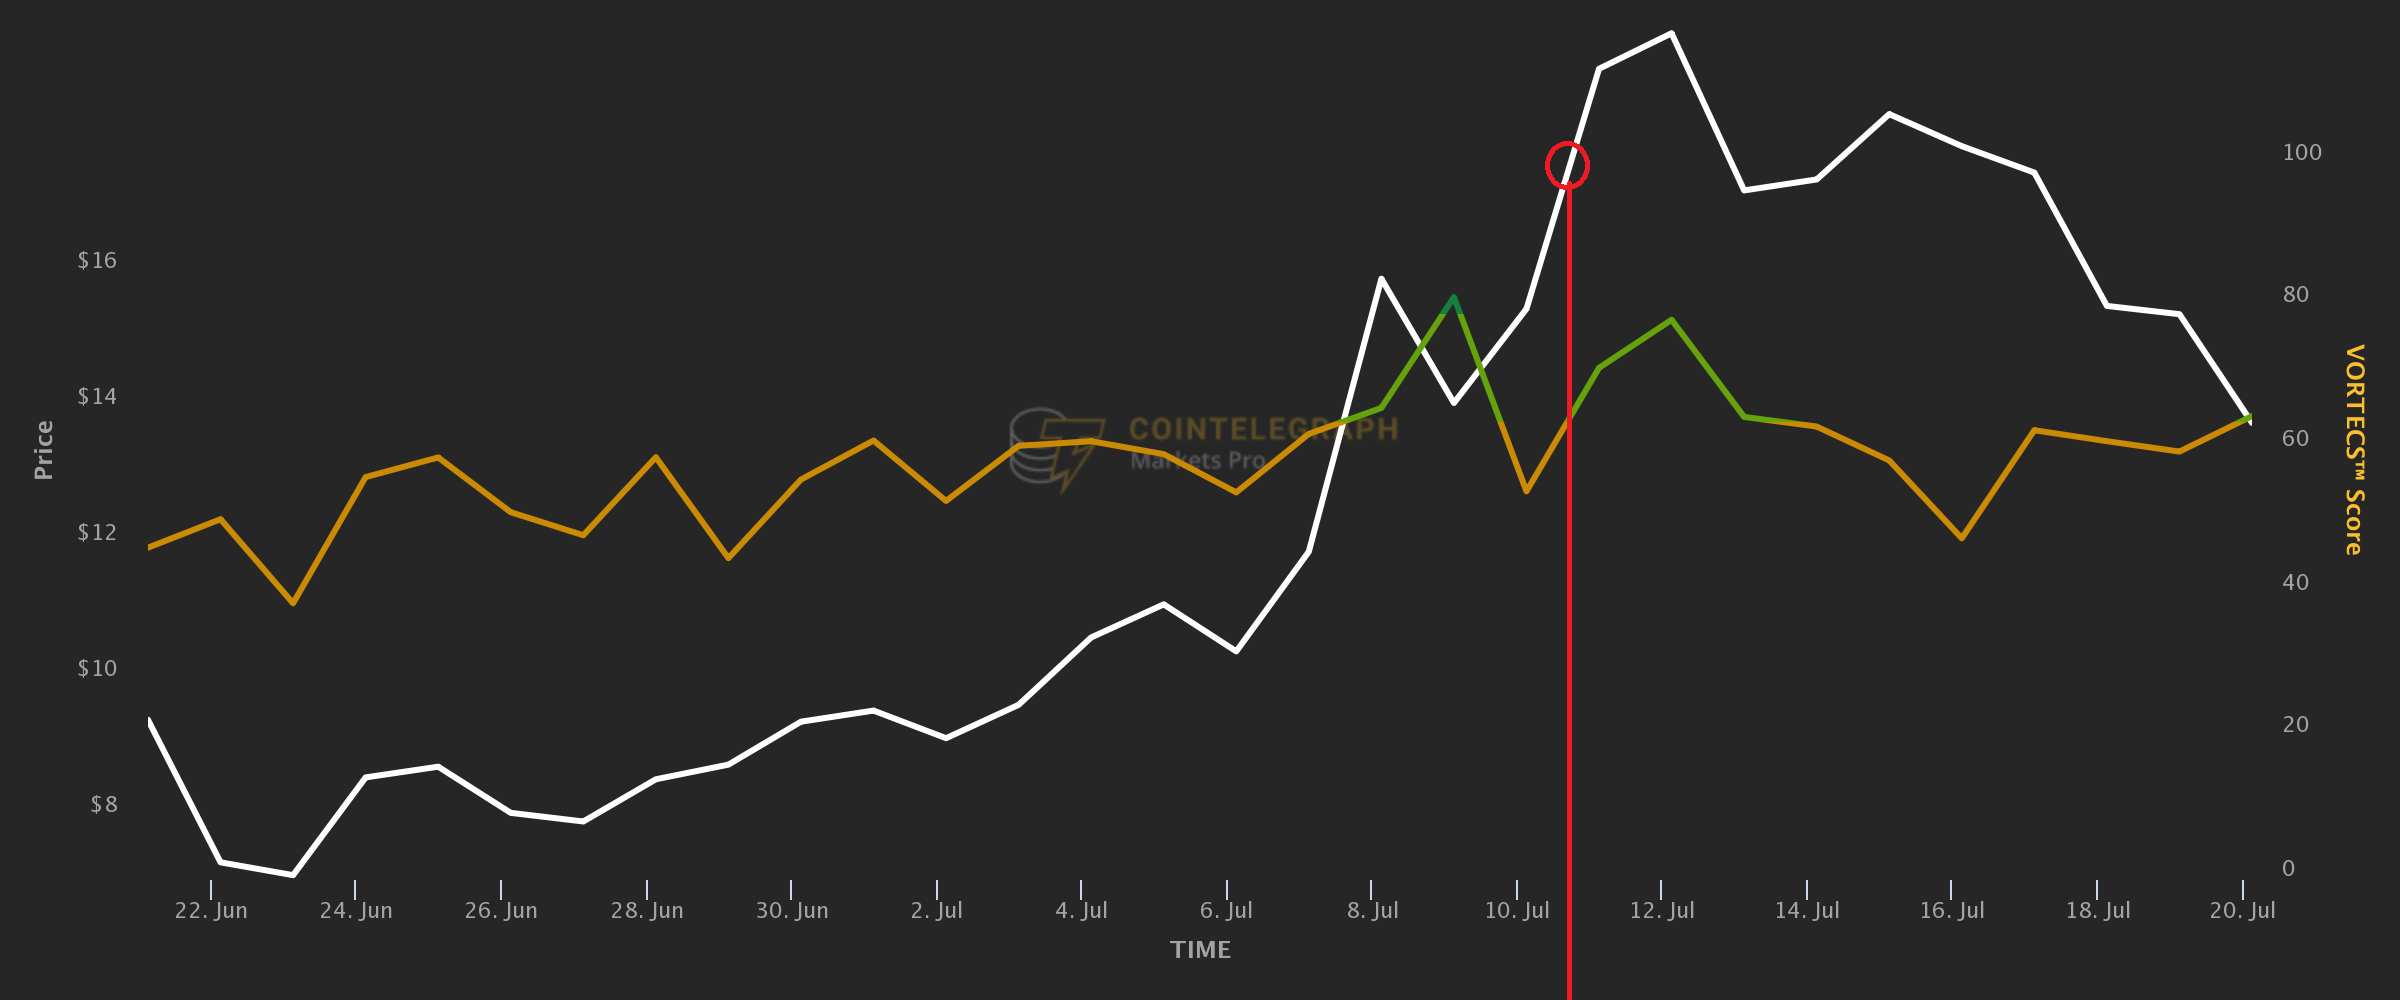
 FLOW’s Price vs VORTECS™ chart. Source: Cointelegraph Markets Pro
Flow Dapper Lab’s (FLOW’s) peak tweet volume came late on July 10 (red circle in the graph) in response to a highly successful week that the asset had, more than doubling its price from $9 to over $18.
A high VORTECS™ score that FLOW received some 50 hours earlier indicated that in the past, such rallies unfolded in several rounds and that historical precedent suggested a possibility of the second leg. Sure enough, the price kept climbing even after the wave of tweets began to recede, eventually hitting $21.20
These examples demonstrate that, while an onslaught of tweets alone is not always a harbinger of an impending rally, spotting abnormal Twitter activity early on can lead to a profitable trade. It can be especially useful when combined with other metrics and a robust understanding of the coin-specific context.
Disclaimer. Cointelegraph is a publisher of financial information, not an investment adviser. We do not provide personalized or individualized investment advice. Cryptocurrencies are volatile investments and carry significant risk including the risk of permanent and total loss. Past performance is not indicative of future results. Figures and charts are correct at the time of writing or as otherwise specified. Live-tested strategies are not recommendations. Consult your financial advisor before making financial decisions. Full terms and conditions.


