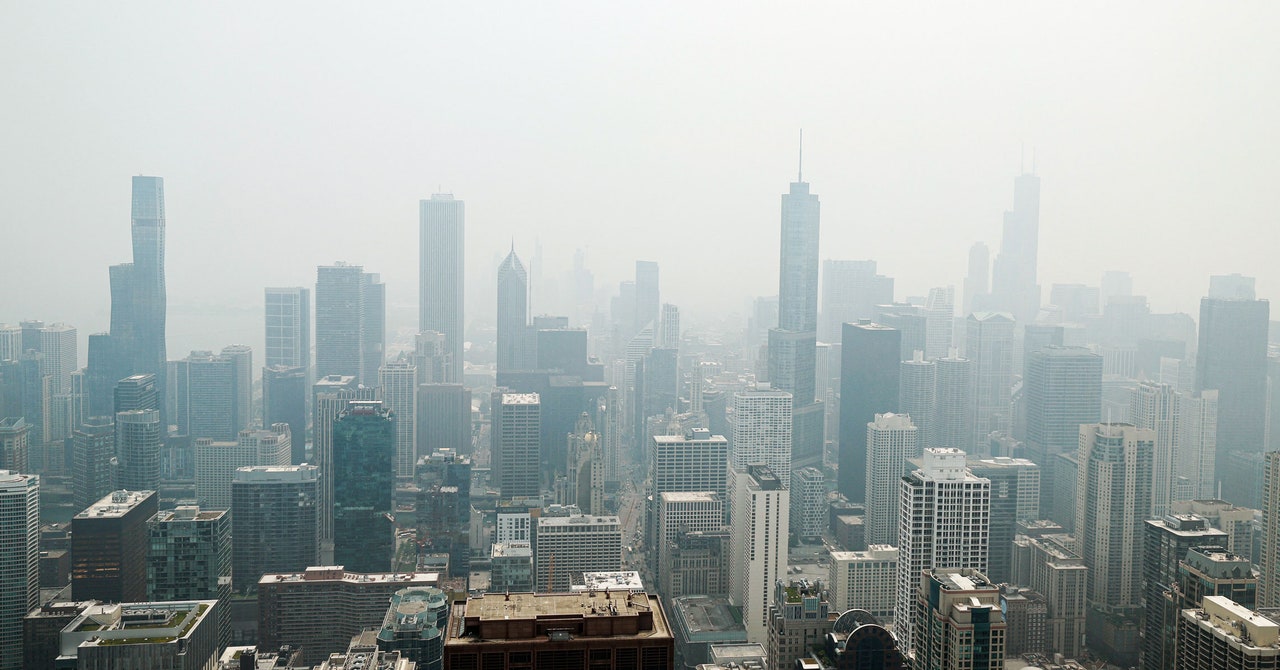
Right now, Detroit, Chicago, and Minneapolis have the unhealthiest air in the world, save for Dubai. Canadian wildfires are spewing smoke that’s wafting south, blanketing the Midwest in a toxic haze, just as they did earlier this month along the East Coast. Seventeen states—with nearly a third of the US population—are under air quality alerts.
Video: NOAA
The animation above gives you an idea of the scale and severity of what’s unfolding. This is from an experimental model called HRRR-Smoke (High-Resolution Rapid Refresh), produced by the National Oceanic and Atmospheric Administration (NOAA), and it has become a critical tool for meteorologists and atmospheric scientists. (You can play with the map here.)
It’s a forecast for how the smoke might move today, showing how it is swirling across not only the Midwest, but the East Coast once again, and even the South. The model predicts that smoke may continue to waft as far south as Georgia through the end of the day. (This map forecasts hours ahead, not days.) The hotter the color, the higher the concentration of smoke in the air.
Specifically, this animation shows “Near Surface Smoke,” or concentrations about 26 feet off the ground. That’s the stuff Midwesterners have to worry about breathing. Wildfire smoke is a cocktail of really nasty stuff, including charred particulate matter, such as plants and dirt, that can get deep into lungs, irritating airways. It’s also loaded with toxic chemicals, like benzene and formaldehyde, and can even develop new nasties as it travels through the atmosphere, like ozone. People with asthma are particularly vulnerable to this toxic gas, which inflames the airways.
Interestingly enough, the HRRR model isn’t based on a direct measurement of the smoke. Instead, it uses infrared satellite data, which pinpoints wildfires and estimates their severity. It then employs weather models, which factor in temperature and wind, to forecast where the resulting smoke is headed.
Video: NOAA
The animation above shows a different measurement: “Vertically Integrated Smoke.” This models a column of air 15.5 miles high. It is the smoke you can see in the sky, as opposed to the smoke that’s a health hazard at ground level.
While the smoke is a public health emergency for people in the Midwest and on the East Coast, it’s also a scientific opportunity. Researchers can use HRRR to model where smoke is going, then use measurements during an event like this to improve that modeling. “From a scientific point of view, we think we’re seeing the HRRR smoke model doing the right thing,” says Stan Benjamin, senior weather modeling scientist at NOAA Global Systems Laboratory and branch leader for development of HRRR. “We do have people in our lab that are working on actually using the measurements of smoke at the surface, and also through satellite images, to refine the initial conditions for the HRRR model.”
The National Weather Service is forecasting that smoky conditions will continue through tomorrow—but the source of all that smoke shows no signs of letting up. Canada is suffering an unprecedented wildfire season, and climate change’s fingerprints are all over it. The hotter the world gets, the easier it is for the atmosphere to suck moisture out of vegetation, turning vast landscapes into tinder. All it takes is a discarded cigarette butt or a lightning strike—which are growing increasingly common in the north—to ignite a blaze that burns out of control.
All of this is all to say, keep the HRRR map handy. Wildfire smoke isn’t just a problem for western states anymore, but for the whole of North America.