Bitcoin (BTC) has slowed down after its sharp relief rally over the past 48-hours, but Ether (ETH) is in no mood to rest as it continues to chase new all-time highs.
The biggest altcoin by market capitalization seems to have received a boost from the news of the launch of a 100-million-euro ($120.8 million) digital bond sale on its network by the European Investment Bank.
Meanwhile, Bitcoin’s institutional adoption has continued to expand. Japanese game developer Nexon disclosed the purchase of 1,717 Bitcoin at an average price of $58,226, for a total consideration of about $100 million. Nexon president and CEO Owen Mahoney said the investment was done to protect shareholder value and maintain the purchasing power of cash assets.
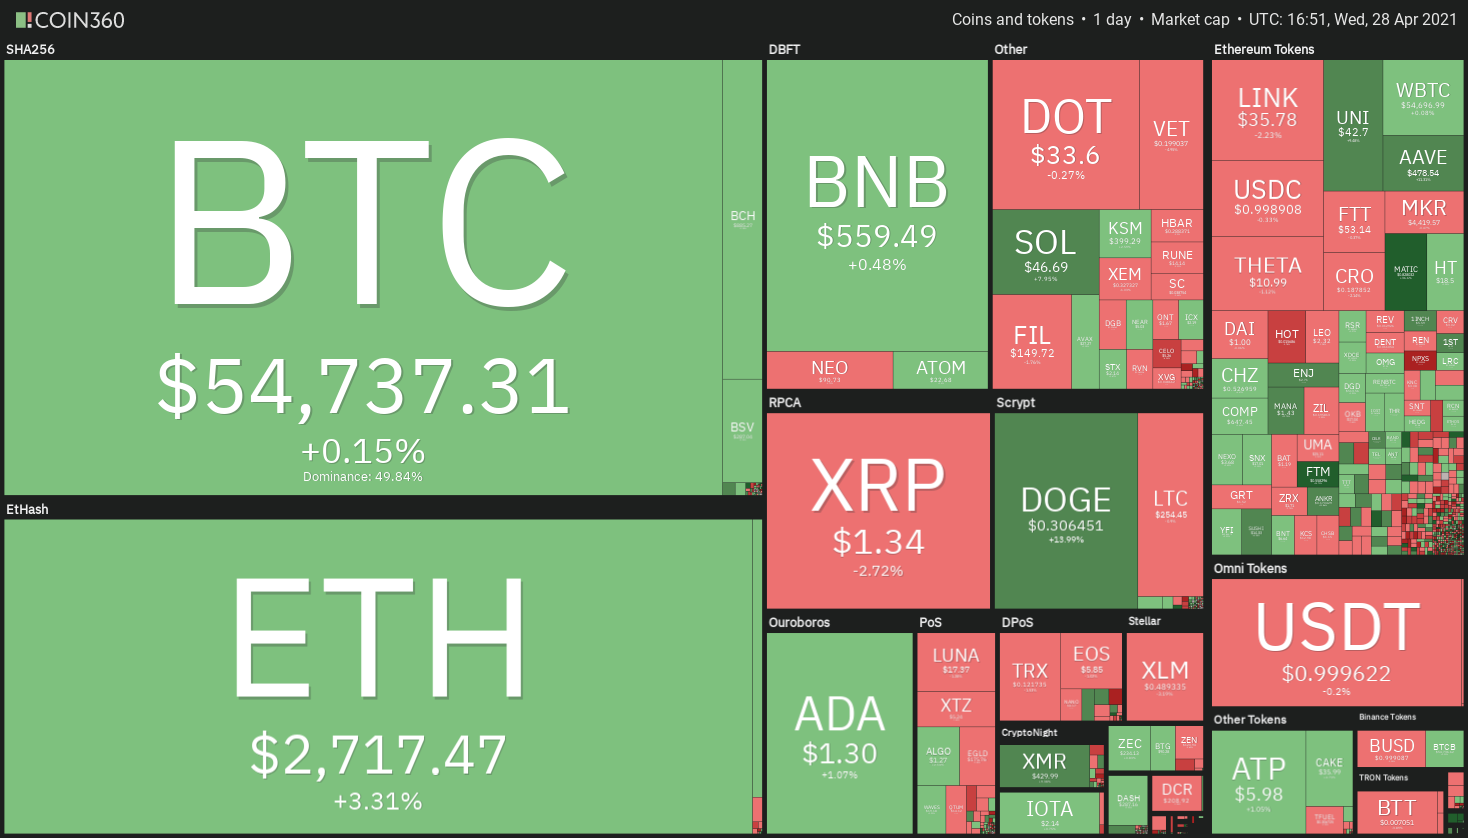 Daily cryptocurrency market performance. Source: Coin360
It is not only the Bitcoin purchases by companies that are catching investor’s attention. Goldman Sachs said that crypto-related stocks have risen 43% this year, outperforming the S&P 500 by a wide margin, which is up over 13% year-to-date. This shows that legacy investors are piling into stocks closely related to cryptocurrencies.
Even Time Magazine has acknowledged the rise of crypto companies, naming Coinbase and the Digital Currency Group in their Top 100 Most Influential Companies list for 2021. While DCG was listed in the ‘disrupter’ category, Coinbase made the grade under the ‘titan’ category.
Will the strengthening fundamentals result in price appreciation across the crypto market? Let’s analyze the charts of the top-10 cryptocurrencies to find out.
BTC/USDT
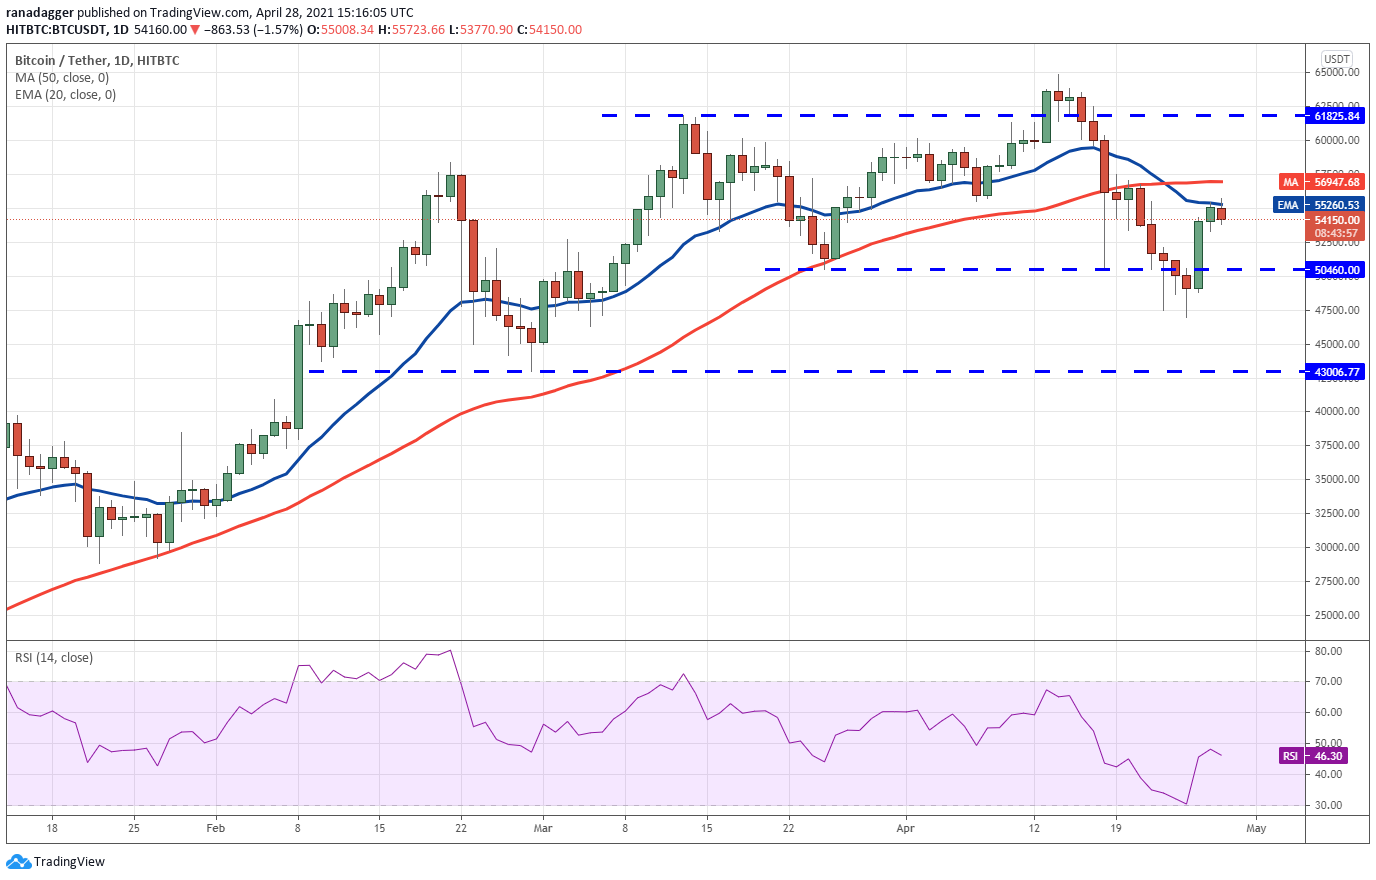
Bitcoin’s relief rally reached the 20-day exponential moving average ($55,260) on April 27 where it has encountered stiff resistance from the bears. The bears are trying to defend the 20-day EMA and will now attempt to sink the price toward $50,460.
 BTC/USDT daily chart. Source: TradingView
However, if the bulls do not give up much ground from the current levels, it will suggest that demand remains strong. That could result in a possible break above the 50-day simple moving average ($56,947). If that happens, the BTC/USDT pair could rally to $61,825 and then to the all-time high at $64,849.27.
Even if the price drops to the $50,460 support but rebounds off it strongly, it will suggest accumulation at lower levels. That will lead the bulls to make one more attempt to clear the hurdle at the moving averages.
This positive view will invalidate if the bears sink the price below the $50,460 to $46,985.02 support zone. That could result in a decline to the critical support at $43,006.77.
ETH/USDT
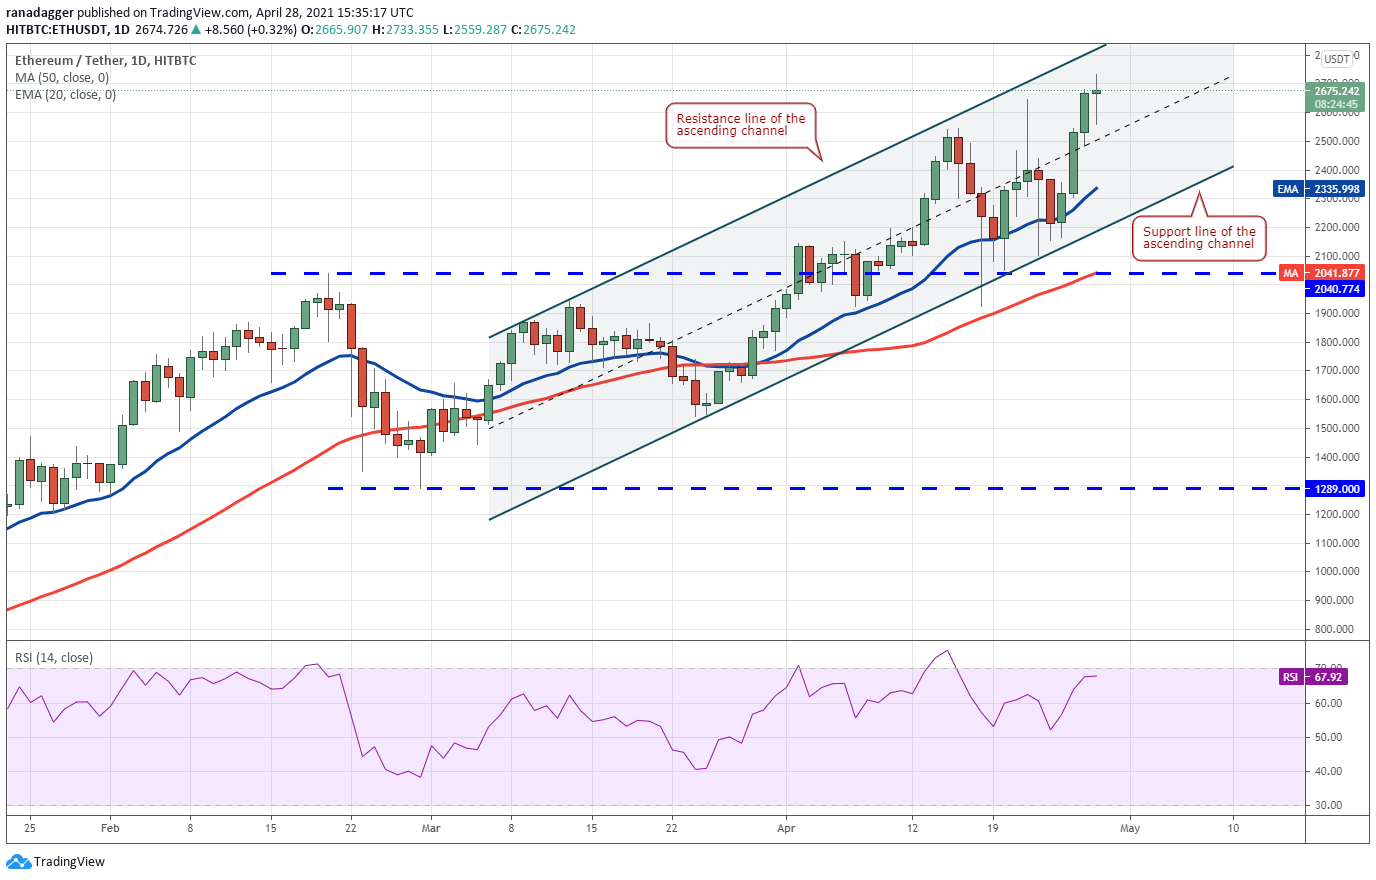
Ether’s rebound off the 20-day EMA ($2,336) picked up momentum on April 26 and the bulls pushed the price to a new all-time high on April 27. That has been followed by another up-move today, but the Doji candlestick pattern suggests the rally may be tiring in the short term.
 ETH/USDT daily chart. Source: TradingView
The first support on the downside will be $2,500 and if that breaks, the decline could reach the 20-day EMA. A strong bounce off this support will suggest that traders are aggressively buying on dips.
The rising moving averages and the relative strength index (RSI) near the overbought zone suggest the path of least resistance is to the upside. If the bulls pierce the resistance line of the ascending channel, the ETH/USDT pair could reach $3,000.
Conversely, a break below the 20-day EMA could pull the price down to the support line of the channel. A break below this support could challenge the 50-day SMA ($2,041).
BNB/USDT
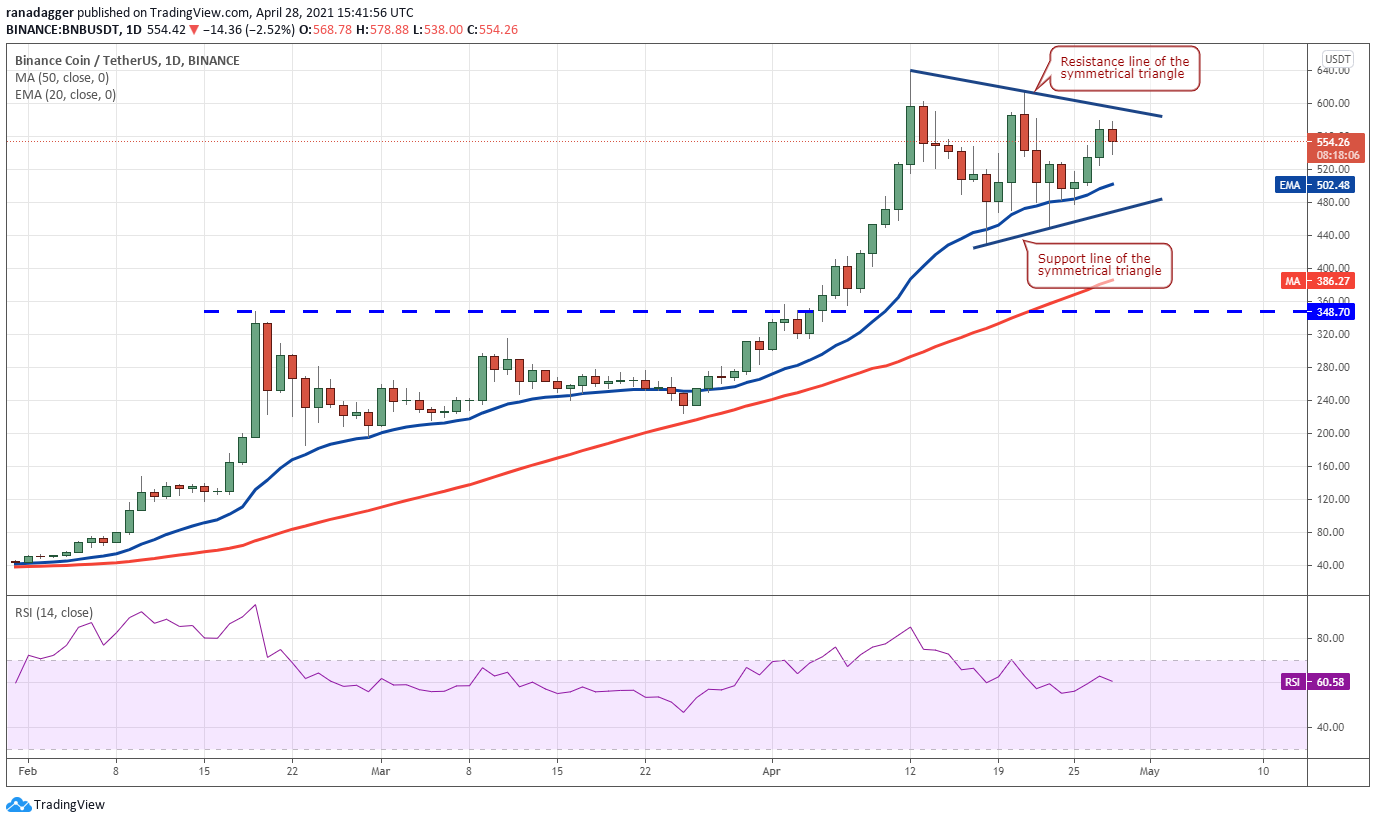
Binance Coin (BNB) is gradually moving toward the resistance line of the symmetrical triangle. The rising moving averages and the RSI in the positive territory suggest the path of least resistance is to the upside.
 BNB/USDT daily chart. Source: TradingView
A breakout and close above the triangle will indicate that the demand exceeds supply and that could result in the start of the next leg of the uptrend which could reach $808.57.
Contrary to this assumption, if the price turns down from the resistance line, it will suggest that bears are active at higher levels. That could keep the BNB/USDT pair stuck inside the triangle for a few more days. A breakdown and close below the triangle will signal a possible trend reversal.
XRP/USDT
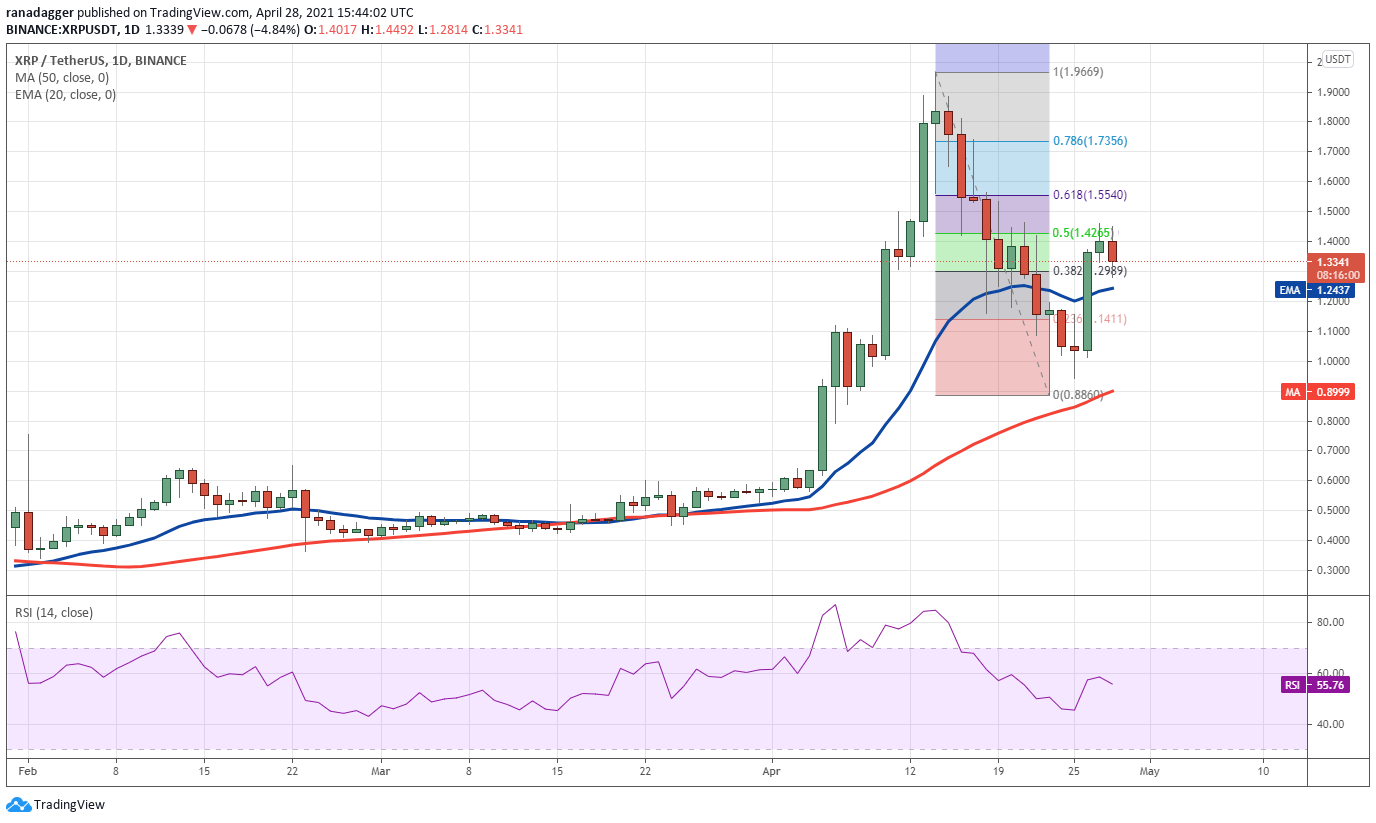
XRP surged above the 20-day EMA ($1.24) on April 26, suggesting that selling has exhausted in the short term. However, the altcoin is facing resistance at $1.46, just above the 50% Fibonacci retracement level at $1.42.
 XRP/USDT daily chart. Source: TradingView
If the XRP/USDT pair declines below the 20-day EMA, it will suggest that bears are selling on rallies. That could open the doors for a drop to the 50-day SMA ($0.89).
Conversely, if the bulls defend the 20-day EMA and push the price above $1.46, the pair may rally to $1.55. A breakout of this resistance will suggest that bulls are back in the driver’s seat. The pair could then retest the 52-week high at $1.96.
ADA/USDT
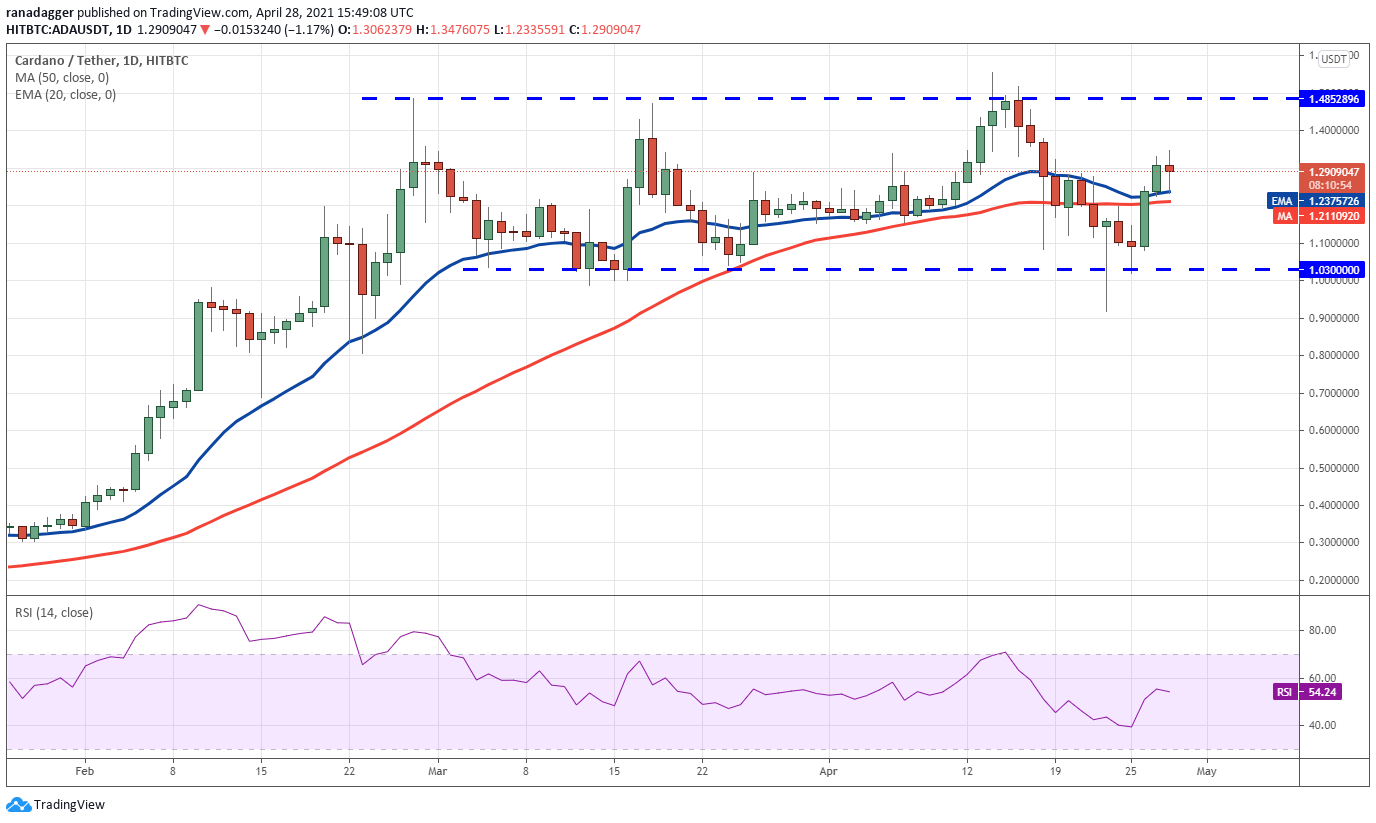
Cardano (ADA) surged above the moving averages on April 26 and the long tail on today’s candlestick suggests traders bought the dip to the 20-day EMA ($1.23). This is a positive sign as it shows that buyers are accumulating on dips.
 ADA/USDT daily chart. Source: TradingView
The ADA/USDT pair could now attempt a rally to $1.48 where the bears are likely to mount a stiff resistance. If the price turns down from this level, the pair is likely to drop to the moving averages and remain range-bound for a few more days.
Contrary to this assumption, if the bulls drive the price above the $1.48 to $1.55 overhead resistance zone, the pair could start the next leg of the uptrend, which has a target objective at $2.
DOGE/USDT
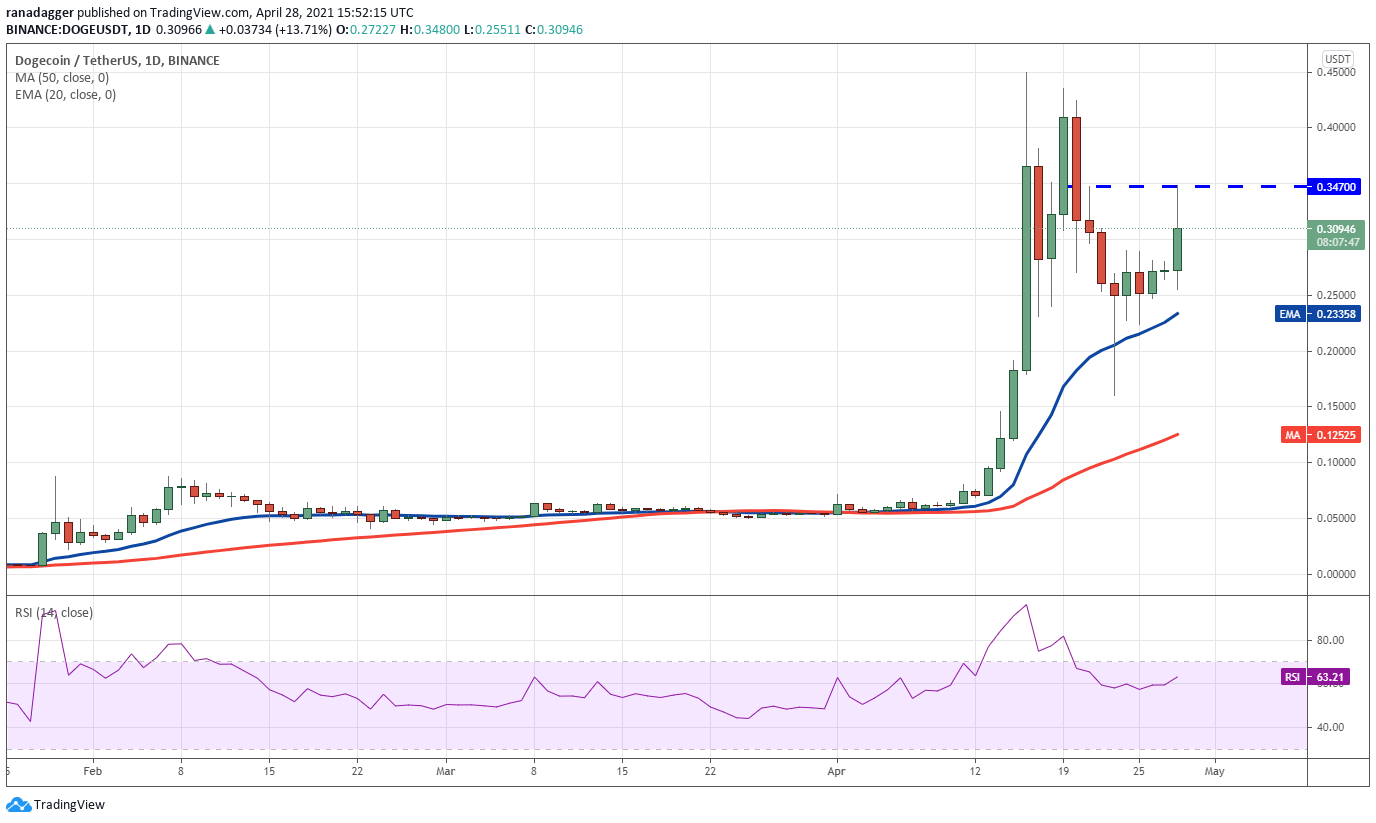
The inside day candlestick pattern on April 26 and a Doji candlestick pattern on April 27 showed indecision among the bulls and the bears. That uncertainty resolved to the upside today and the bulls pushed Dogecoin (DOGE) to the overhead resistance at $0.34.
 DOGE/USDT daily chart. Source: TradingView
If bulls can clear the hurdle at $0.34, the DOGE/USDT pair could start its journey toward $0.42 and then to the all-time high at $0.45. The rising 20-day EMA ($0.23) and the RSI in the positive zone suggest the bulls are in control.
However, the bears are likely to pose a stiff challenge at the $0.34 resistance. A dip below $0.29 may weaken the bullish momentum. The bears will then smell an opportunity and try to pull the price down to the 20-day EMA. A break below this support could result in a decline to $0.15.
DOT/USDT
Polkadot’s (DOT) relief rally is facing resistance near the 20-day EMA ($35.54), which suggests that sentiment has turned negative and traders are selling on rallies. The bears will now try to sink the price back toward the critical support at $26.50.
 DOT/USDT daily chart. Source: TradingView
The downsloping 20-day EMA and the RSI turning down from the downtrend line suggest that bears are at an advantage. A break below the $26.50 support will complete a large head and shoulders pattern, which could signal the start of a deeper correction.
Conversely, if the bulls do not give up much ground from the current level, it will indicate buying on every minor dip. That will enhance the prospects of a breakout of the moving averages, resulting in a rally to $42.28 and then a retest at $48.36
UNI/USDT
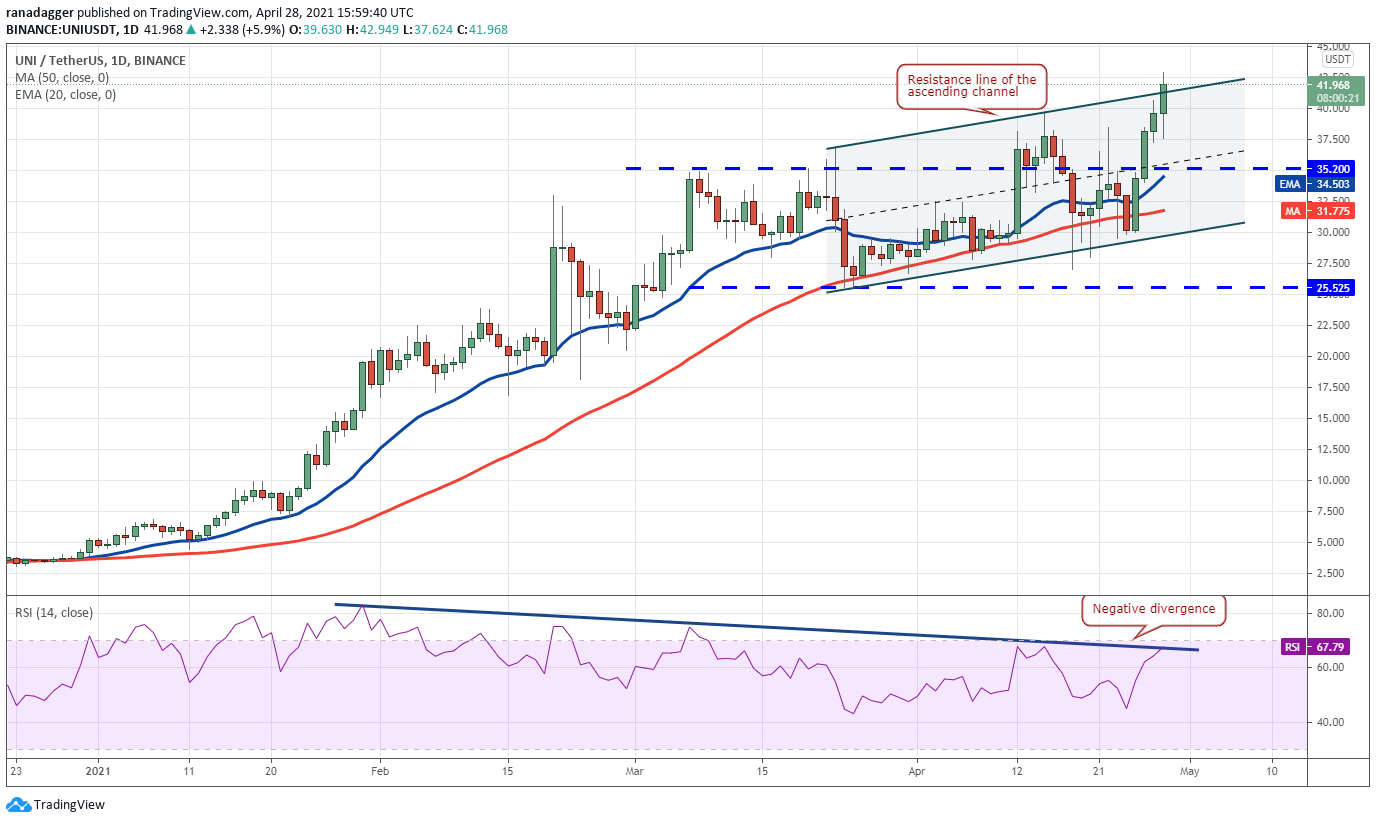
Uniswap (UNI) broke above the $39.60 overhead resistance and made a new all-time high on April 27. The up-move has continued today and the bulls have pushed the price above the resistance line of the ascending channel.
 UNI/USDT daily chart. Source: TradingView
If the UNI/USDT pair sustains above the channel, it will suggest strong momentum. The pair could then rally to $44.88 and then $50. The rising 20-day EMA ($34.50) and the RSI trying to break above the downtrend line suggest the bulls have the upper hand.
Alternatively, if the price fails to sustain above the channel, a drop to $38 is possible. If the bulls flip this level to support, the possibility of a break above the channel increases. This positive view will invalidate if the pair turns down and slips below $35.20.
LTC/USDT
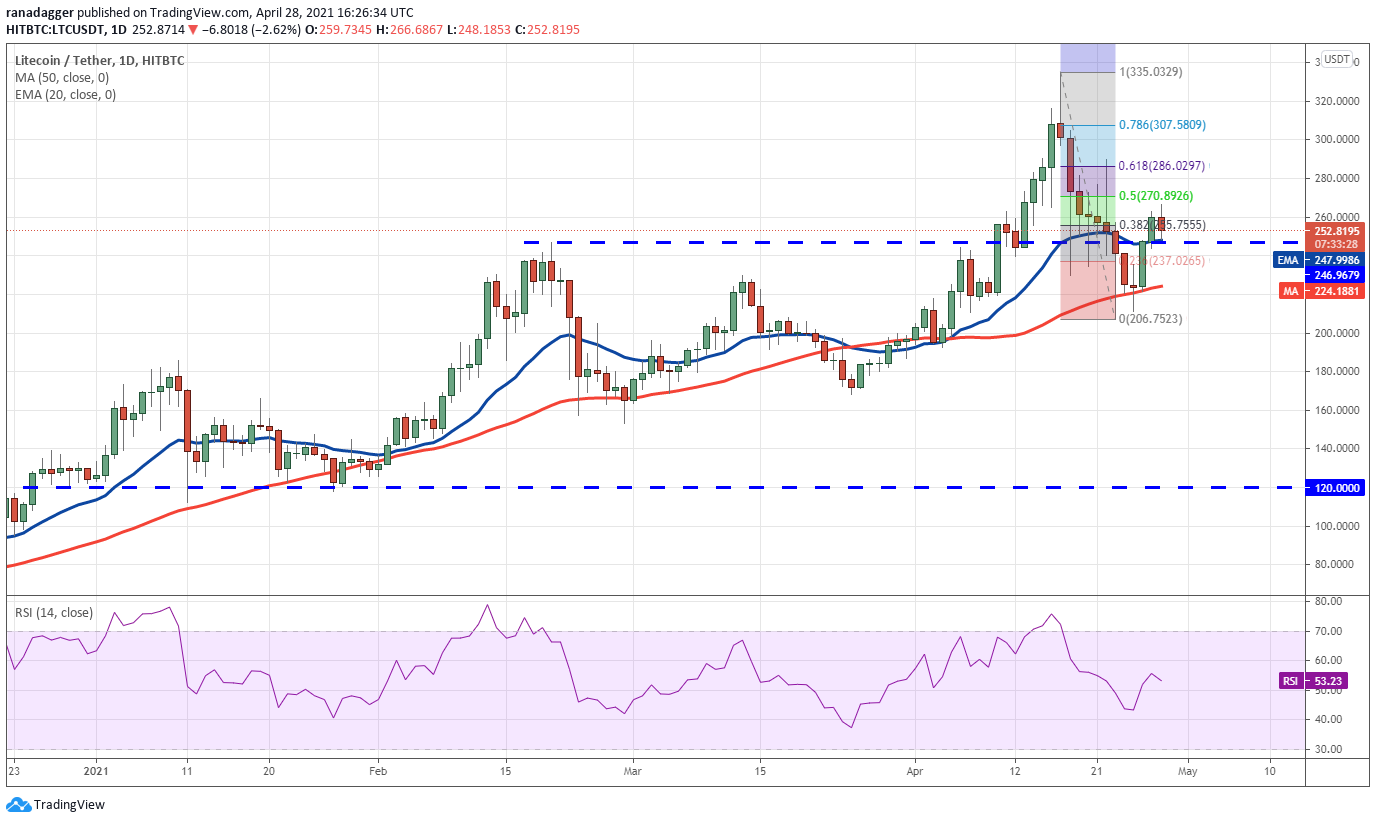
Litecoin’s (LTC) relief rally rose above the 20-day EMA ($247) on April 28, suggesting the near-term selling pressure has eased. However, the bears are unlikely to give up easily.
 LTC/USDT daily chart. Source: TradingView
The LTC/USDT pair is facing resistance near the 50% Fibonacci retracement level at $270.89. If the bears sink the price below the 20-day EMA, the pair could drop to the 50-day SMA ($224). This is an important level to watch out for because if it cracks, the correction may deepen to $168.
On the contrary, if the bulls successfully defend the 20-day EMA, it will indicate demand at lower levels. The buyers will then try to push the price above $270.89 and reach the 61.8% Fibonacci retracement level at $286.02.
This level may again act as stiff resistance but if the bulls drive the price above it, the pair could be on track to retest $335.03.
BCH/USDT
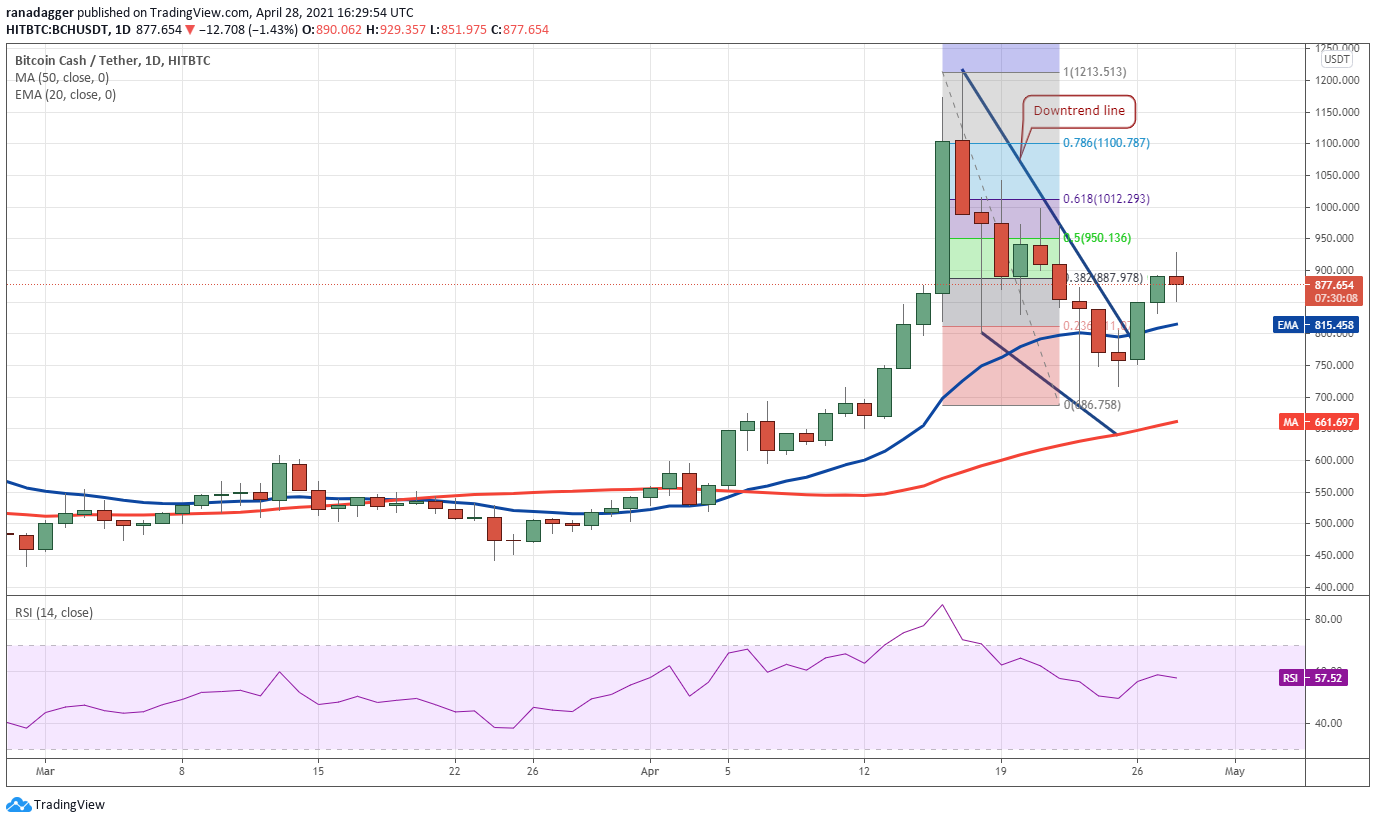
Bitcoin Cash (BCH) broke above the downtrend line on April 26, suggesting the start of a relief rally. The pullback is showing the first signs of resistance near the 50% Fibonacci retracement level at $950.13.
 BCH/USDT daily chart. Source: TradingView
The bears will now try to sink the price below the 20-day EMA ($815). If they succeed, the BCH/USDT pair could drop to the 50-day SMA ($661). Such a move will suggest that the sentiment has turned negative and traders are selling on rallies.
Conversely, if the price rebounds off the 20-day EMA and breaks above $950.13, it will indicate that traders are buying on dips. That could push the price toward the 61.8% Fibonacci retracement level at $1,012.29. A break above this level will tilt the advantage in favor of the bulls.
The views and opinions expressed here are solely those of the author and do not necessarily reflect the views of Cointelegraph. Every investment and trading move involves risk. You should conduct your own research when making a decision.
Market data is provided by HitBTC exchange.